 Posted by
 I’ve made some improvements to the El Niño forecast app and version 1.1 is now available on the app store. I have been working on some advanced tracking features that are not readily available in one single location online.
Daily Niño index tracker
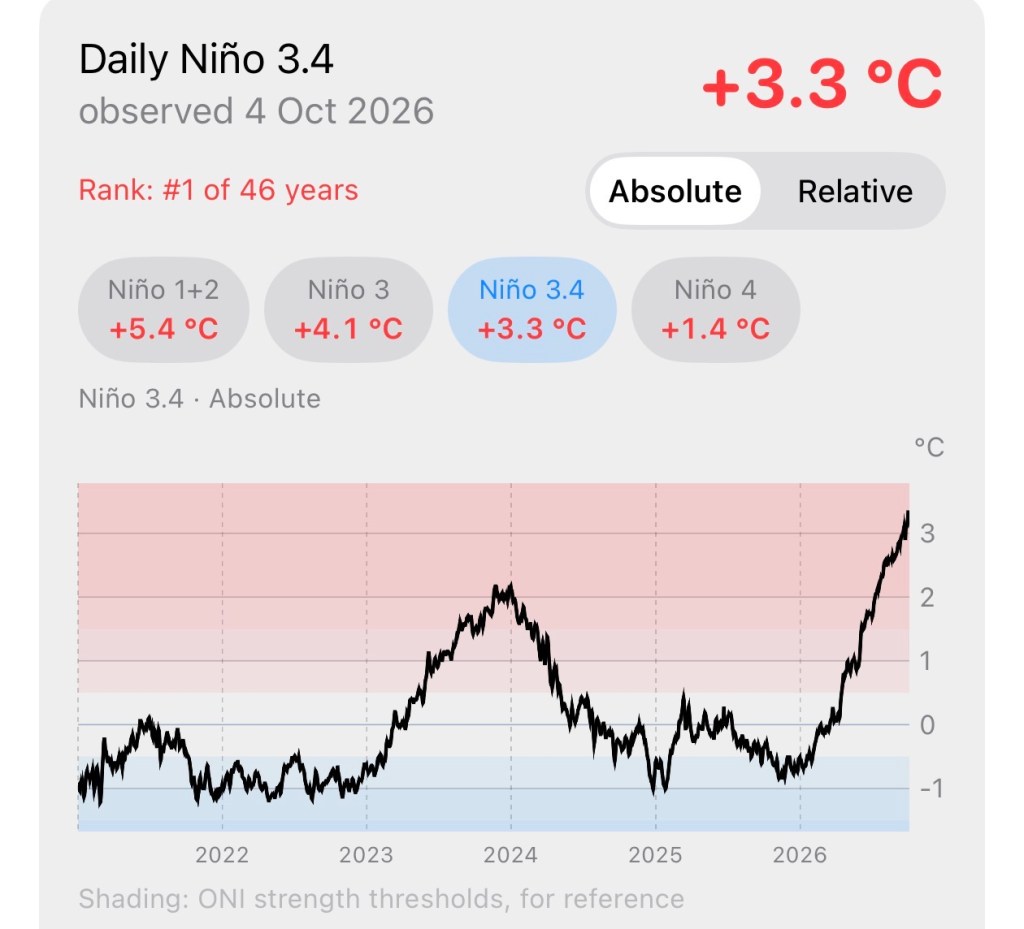
The Niño 3.4 index has been making headlines for its record-breaking values that seem to get higher every day. The latest absolute index is around +3.3 °C and continuing to rise. The app predicts a peak of around 4 °C in early December.
ENSO Longitude Index tracker and forecast
The ENSO Longitude Index is a lesser-known tracking index that tracks the mean longitude where sea surface temperature is above the tropical average. This serves as a good proxy for where tropical convection will form, which then affects the position and strength of the mid-latitude jet stream.
An east-based El Niño (red zone in the plot below) would favor a strong jet stream across the southern half of the United States and active weather in California.
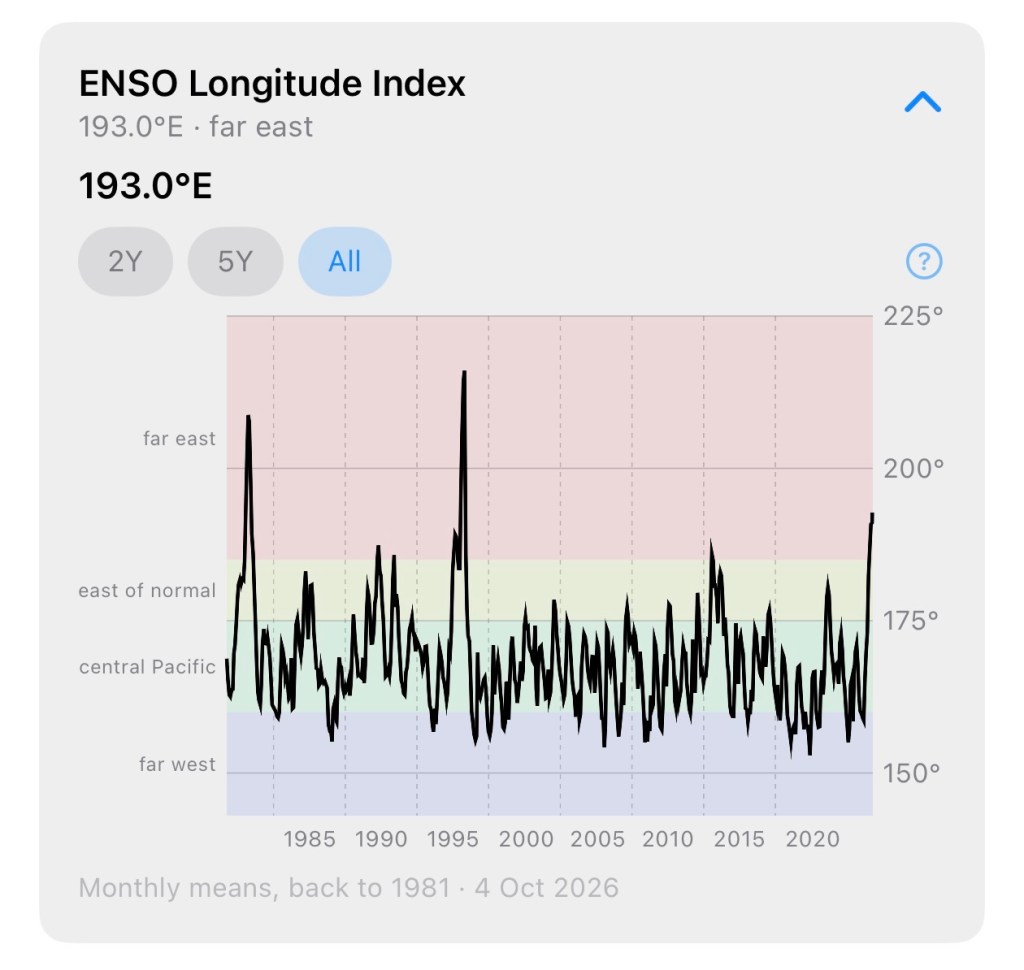
The ELI forecast for this winter shows a “far east” peak at around 220 degrees, a location that has only been documented in the last 50 years in two famous El Niño events — 1982-83 and 1997-98.
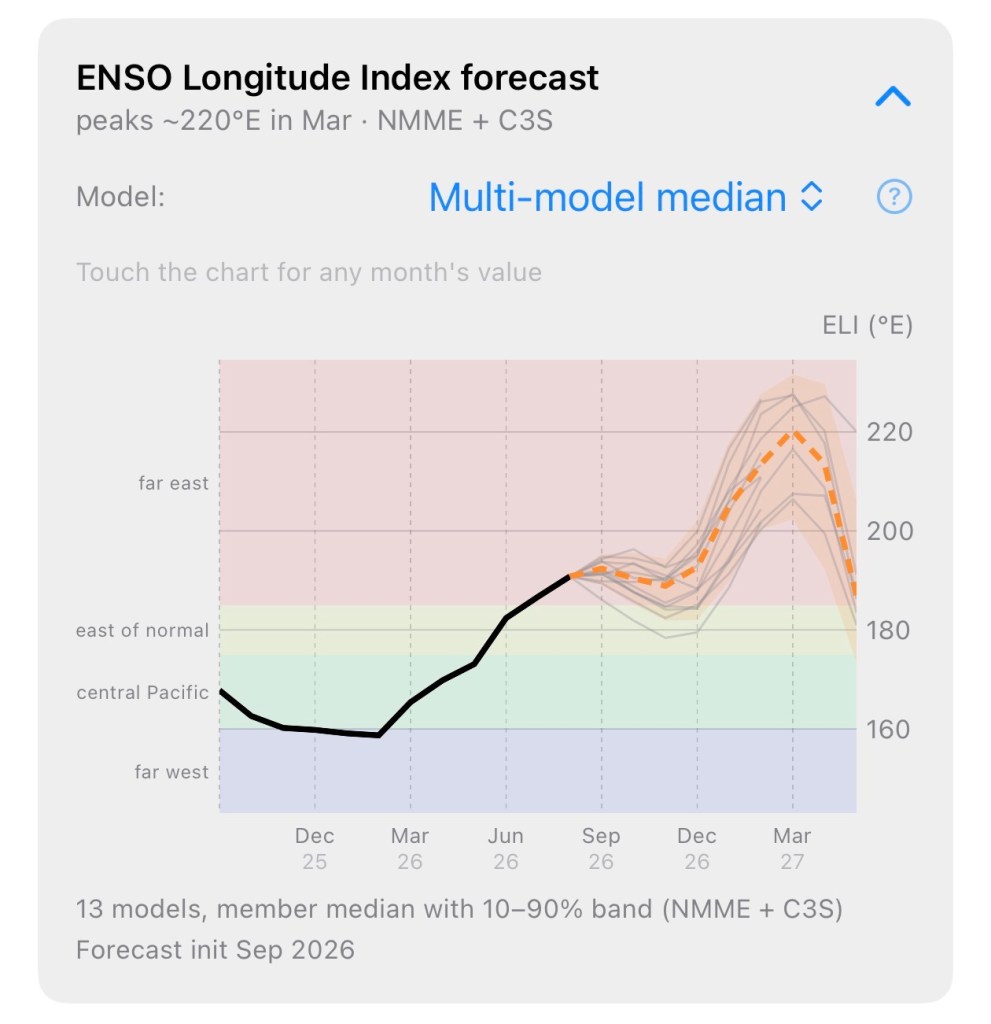
Thanks to Anthony Edwards for the ELI suggestion — it’s probably the best single predictor of whether this El Niño will produce the canonical stormy winter in California.
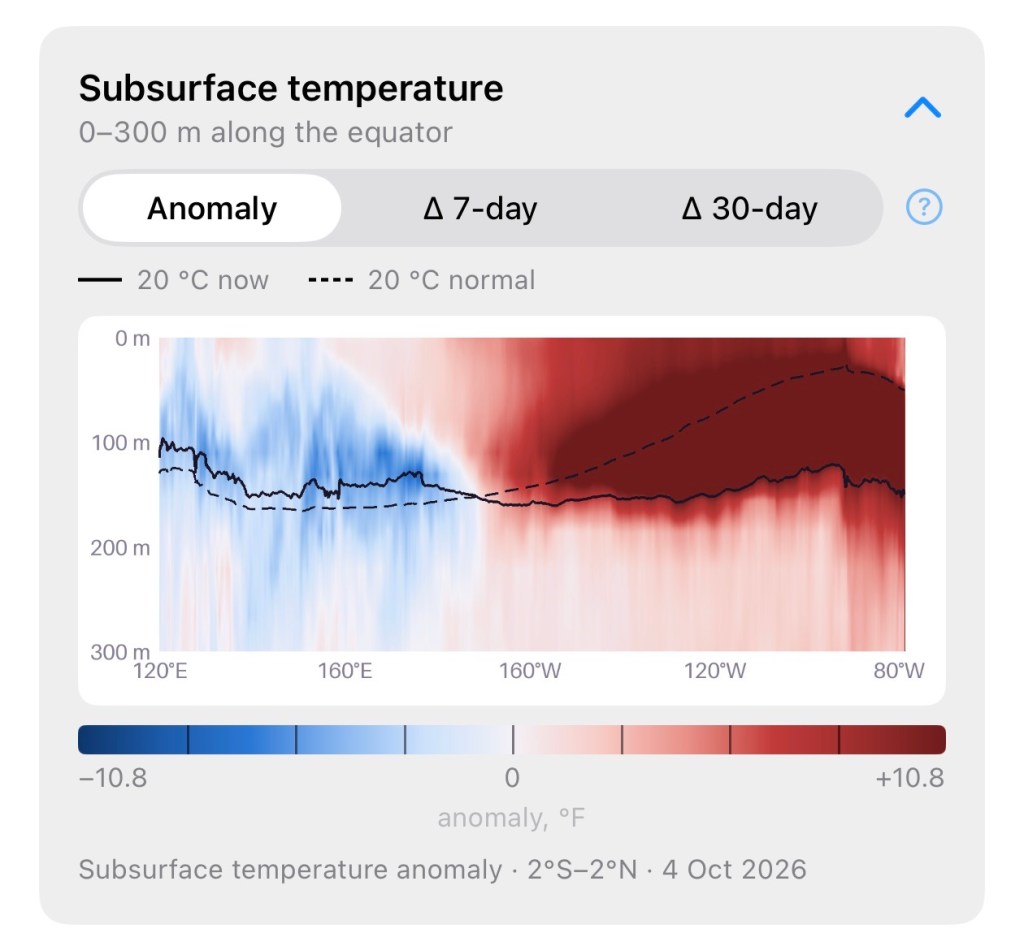
Subsurface temperature
Another advanced tracking tool is the subsurface temperature in a narrow band along the equator. An evolving El Niño can often be seen below the surface before the effects become apparent in SST plots. The volume of warm water in the equatorial east Pacific is truly phenomenal at the moment.
Kelvin Wave tracking tools
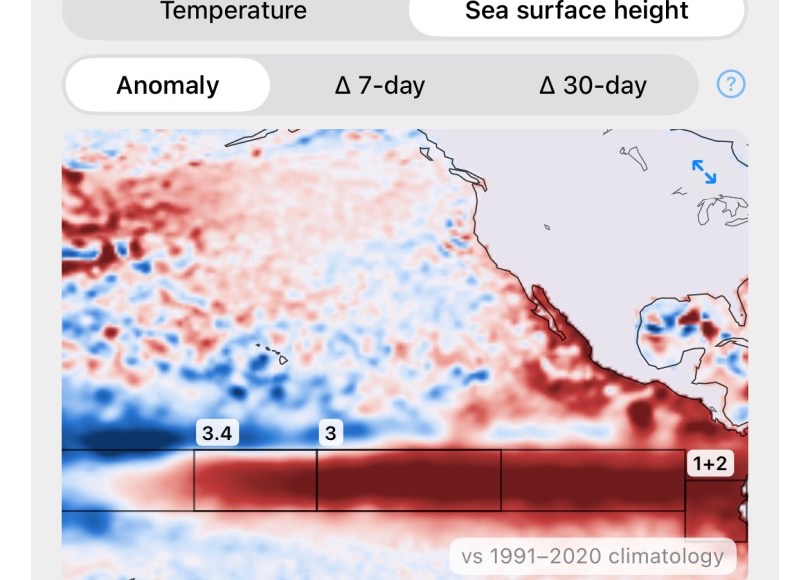
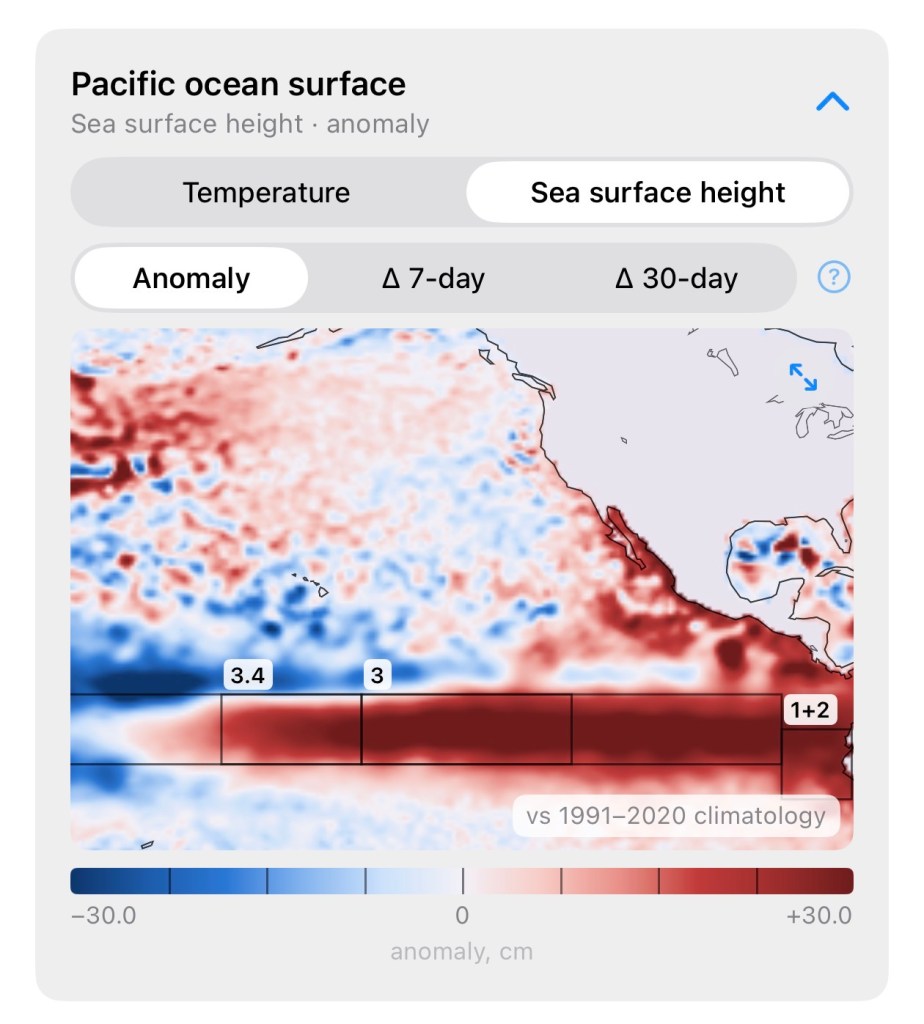
A major impact of El Niño currently in the news is a coastal Kelvin Wave that is making its way northward along Baja California. One can track the Kelvin Wave by following the evolution of sea surface height anomalies moving south to north along the western coast of North America.
Advanced Kelvin Wave trackers coming soon
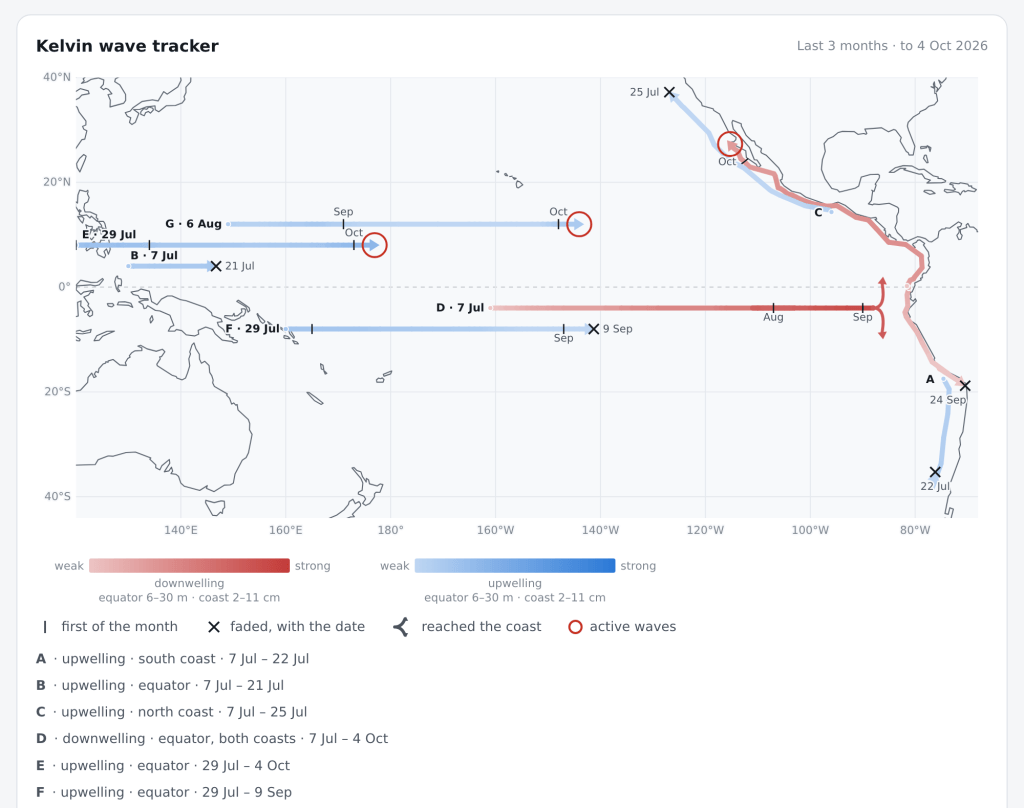
I didn’t squeeze these into v1.1 of the app, but I have some Kelvin Wave tracking tools that I’m testing on my staging website.
Here is a map of Kelvin Wave evolution over the past 3 months. Kelvin Waves start along the equator, where they can be tracked using the depth of the 20 °C isotherm (see subsurface temperature section above). Upwelling Kelvin waves are associated with colder water reaching the surface, while downwelling Kelvin waves like the one in the news are associated with warmer water.
Kelvin waves move west to east along the equator. if they reach the west coast of the Americas, they propagate up and down the coastline and are tracked using sea surface height anomalies.
And a few more features…
- Full text and figures of monthly CPC El Niño updates
- Historical and forecast Hovmöller diagrams of sea surface temperature, height, and more
Free app download codes still available
If you would like to try out the El Niño Forecast app, I still have plenty of download codes available. Just fill out the contact form and I’ll send a code your way (iOS only).
I’ll have more updates to share in the next few weeks — where2.ski now has experimental weekly forecasts that begin in November and I just submitted an entirely new iOS app that will hopefully be available later this month.

