

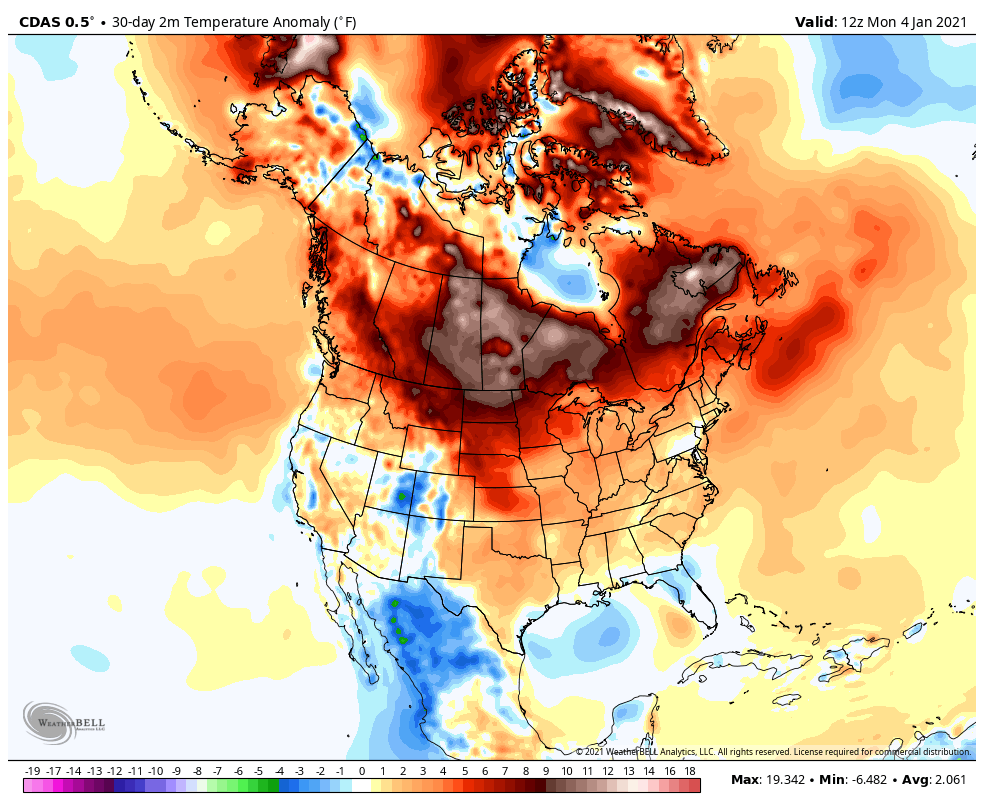
The calendar shows that it is now January 2021 but winter weather has yet to make much of an appearance in the continental United States. Temperatures over the past 30 days have run above normal over the majority of the US and Canada.
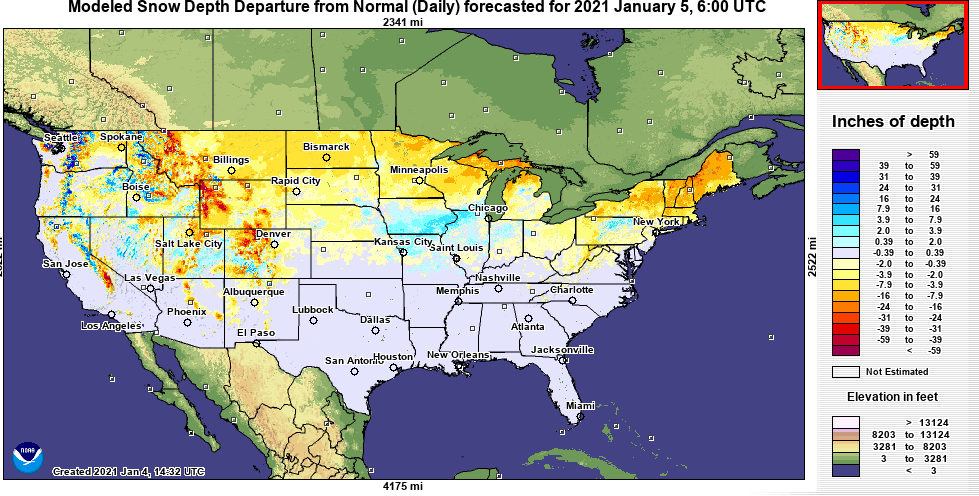
Not surprisingly, snow depth is below normal over a large portion of the northern US. Mountain snow is below normal over much of the western US, although higher elevations in the Pacific Northwest are above normal.
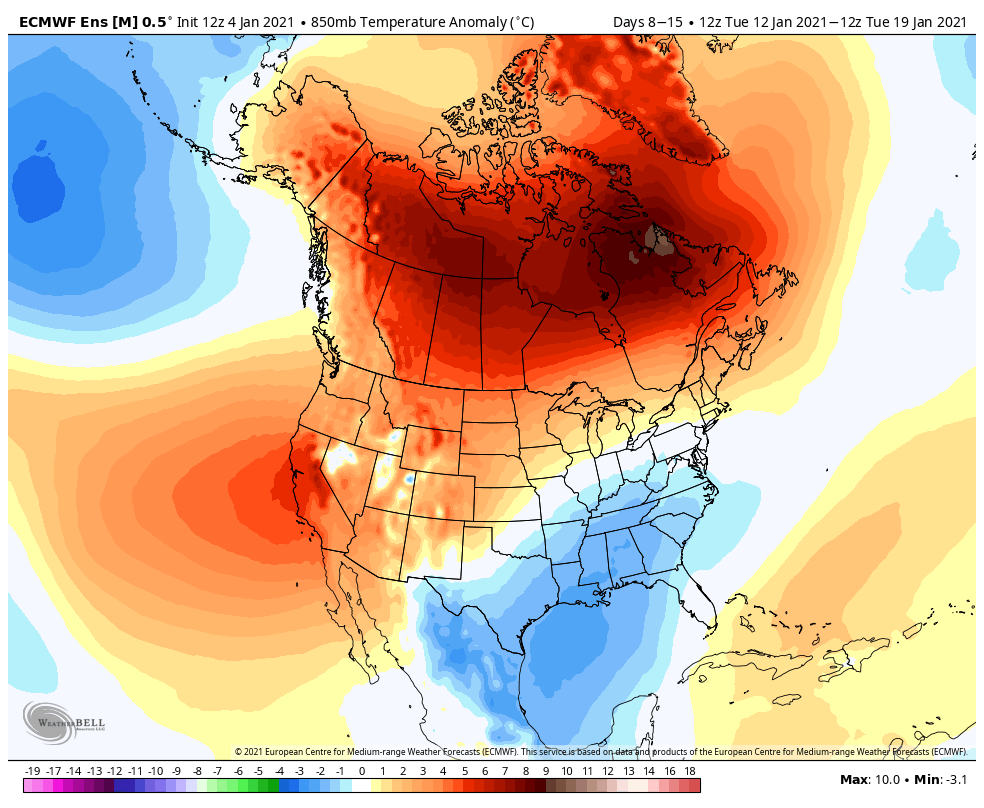
Model forecasts for the next 2 weeks offer little hope for improvement, with cold anomalies expected over the southern half of the US and warmth elsewhere.

If the extended forecasts continue to show warming we might be talking about the start of spring in a few weeks. However, recent events at high latitudes suggest that it’s far too soon to declare a missed winter. Instead, a potent spell of winter weather appears likely as we move into late January and early February.
What is sudden stratospheric warming (SSW) and what does it have to do with arctic air outbreaks?
An SSW event is exactly what it sounds like, it is a sudden and rapid warming of the stratosphere (i.e. the atmospheric layer above the troposphere, just above the cruising altitude of airplanes). SSW events occur over the north pole in winter, and the degree of warming can be quite astounding, 50 degrees C or more. Since we’re in the stratosphere, the “warmth” is relative to our starting point of -75 degrees C or so.
An SSW event precedes the breakdown of the polar vortex. When the polar vortex breaks down in mid-winter it usually leads to a migration of arctic air to the mid-latitudes.
Climatologically, major mid-winter SSW events occur around 6 times per decade in the northern hemisphere (Charlton et al. 2007). The initiation of SSW events is caused by high-amplitude waves in the mid-latitude jet stream (breaking Rossby Waves) interacting with the stratosphere.
Visualizing the ongoing SSW event
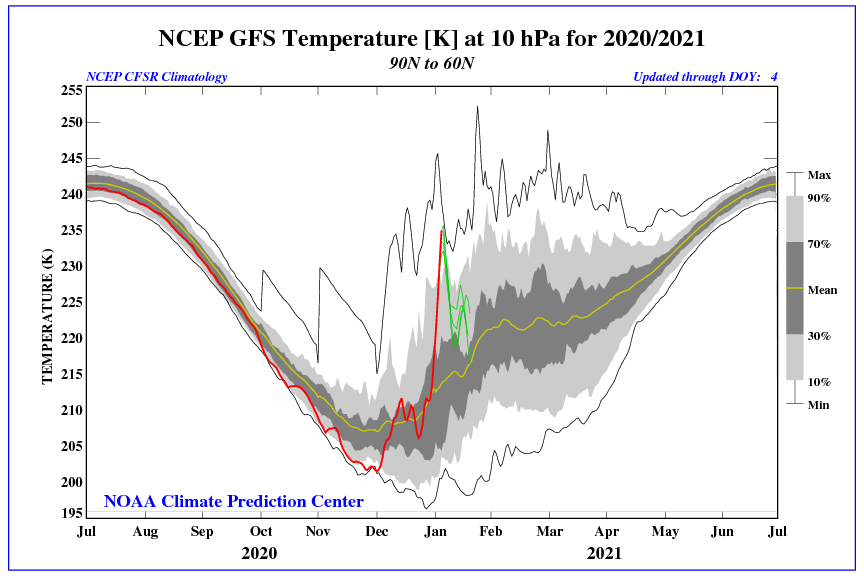
The ongoing SSW event can easily be seen by the red line in the timeseries of arctic-averaged stratospheric temperature jumping to a near-record high for the date.
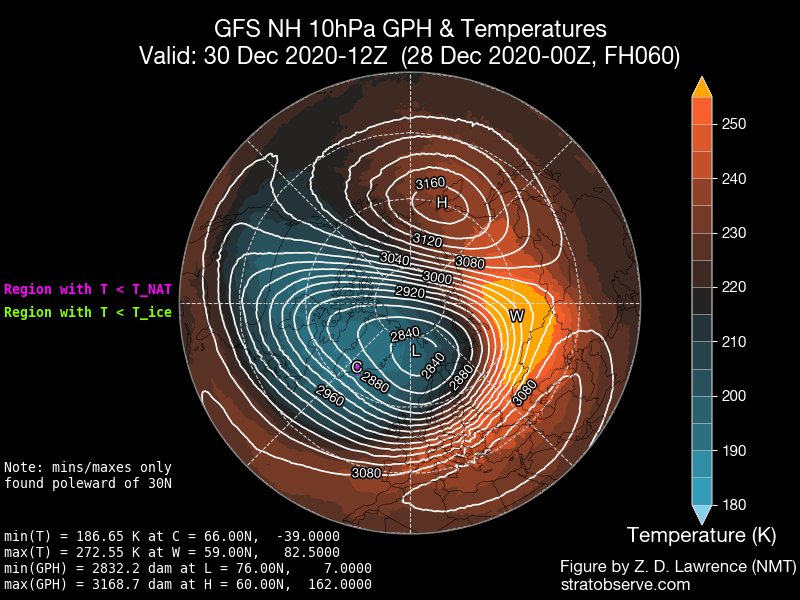
From a north pole view, we can see the anomalous warmth in the stratosphere on December 30, indicated by a orange blob with a “W” over Siberia. The polar vortex, indicated by the blue region with the “L”, was centered over the Greenland Sea.
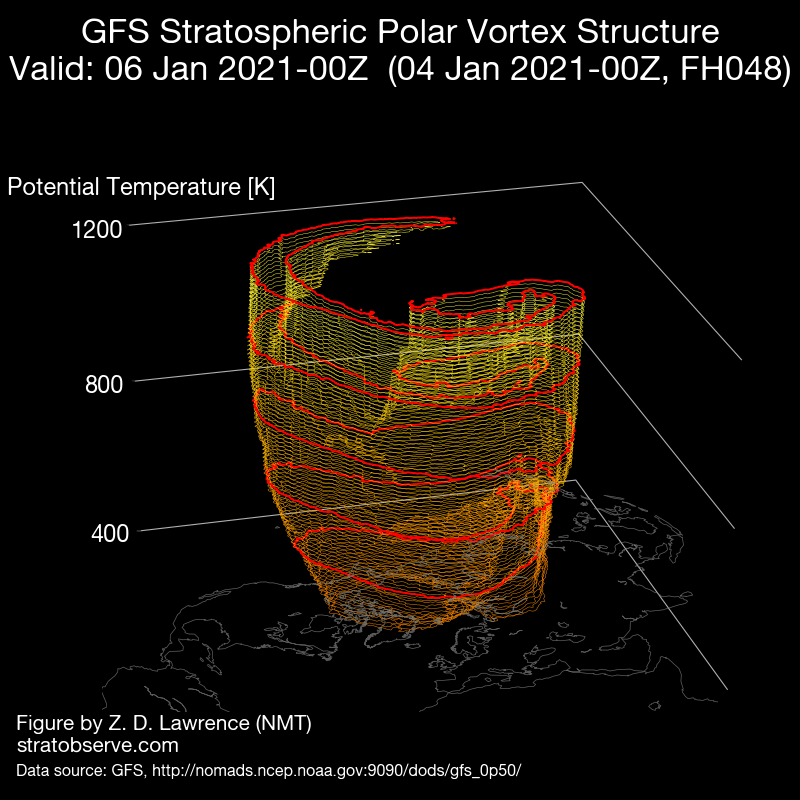
What happens to the polar vortex as the SSW event evolves? The website stratobserve.com, created by Zac Lawrence, contains some awesome graphics that allow us to visualize the polar vortex in 3D.
On December 28, the polar vortex was generally in one piece, centered over the arctic, although it had somewhat of an elliptical and tilted shape which is indicative of the impending breakdown.

Today, January 5th, the polar vortex looks a little more wobbly and elliptical as the SSW event has started to disrupt the polar vortex, but it is still generally in one piece.
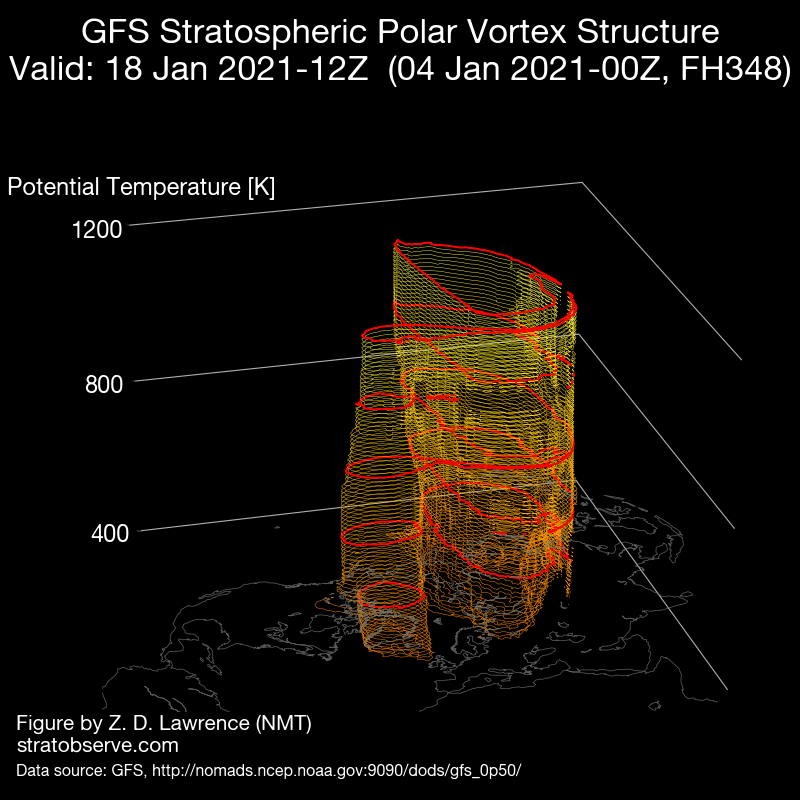
By January 18, the GFS model shows the polar vortex splitting into two, or at least displacing off the north pole.
Zac’s site even has an ensemble plot with most members showing the polar vortex displaced over Europe and Siberia by late January.
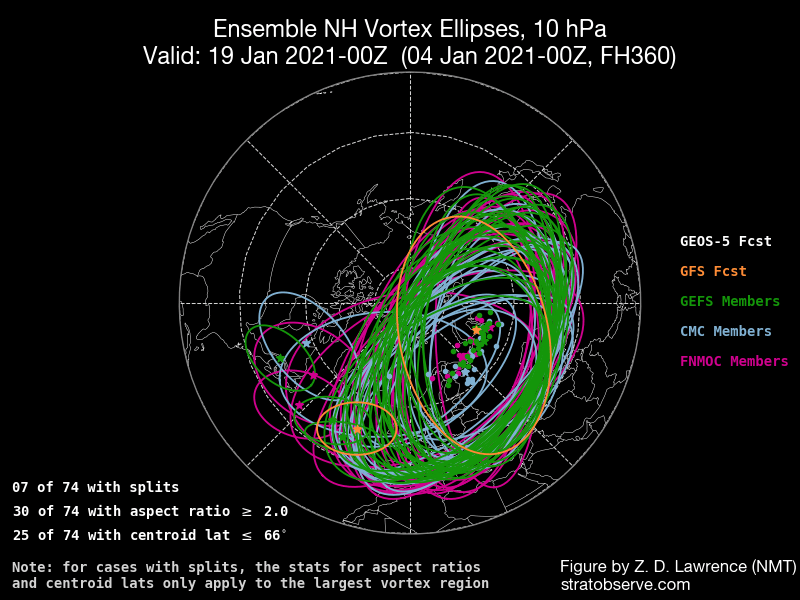
From what I can tell, the initial displacement of the polar vortex into Eurasia is fairly typical of these events. The consequences of split vs. no split are largely unclear. The more interesting question is what happens after that, in late January through early February.
Where is the cold air going to go?
That’s the million dollar question.
The unfortunate reality is that although we know that SSW events lead to polar vortex displacements, we have a relatively limited understanding of how SSW events are related to the evolution of other types of planetary waves in the tropics and mid-latitudes.
There are a few components to consider:
- The net result of a SSW event is an equatorward displacement of the mid-latitude jet stream, which is expected to result in increased odds of cold air over the entire northern hemisphere over a 1-1.5 month period (late January – February 2021).
- As always, the likelihood of a cold air outbreak in the western US is dependent on ridging in the North Pacific (see the figure below from Feb 2019, which was also preceded by an SSW event). Without the North Pacific ridge the cold air will end up elsewhere.
- The whole sequence takes 4-6 weeks to evolve, so it’s too early to know the details about how the pattern will evolve and what it means for cold/snow in the PNW.

Any indication of what will happen in the mid-range models?
To make mid-range (roughly 2 week to 2 month) forecasts, the experts in SSW events tend to keep an eye on various “teleconnection” indices which are proxies for the position of large-scale ridges and troughs. A positive arctic oscillation (AO) tends to indicate ridging in the North Pacific. Currently the AO is strongly negative in association with stormy weather and a “bomb cyclone” over the Aleutians.

Will the AO flip in late January? We’ll see.
The 30-day 500 hPa height anomaly in the ECMWF weeklies (Jan 20-Feb 19) is looking very favorable for cold air in the Pacific Northwest.

It will be very interesting to see what the model forecasts look like when we get to mid-January.
For further reading
For more on SSW events, check out this Youtube weather discussion by Mike Ventrice at The Weather Company which was very helpful in writing this post. A recent blog post by Judah Cohen at AER also provided some useful insight.
