

After the rainiest start to a year on record, a moderate windstorm blasted through most of Washington State with surprisingly little warning. Widespread wind gusts in the 45-55 mph range were recorded in central Puget Sound around midnight – 1 AM on Wednesday January 13 with a max gust of 61 mph in Federal Way. A surge of westerly wind through the Strait of Juan de Fuca brought isolated 50-70 mph winds to Whidbey Island and the Bellingham area.

The wind caused a ton of power outages, 559,000 customers in Washington State, mostly around Puget Sound but also in eastern Washington, Oregon, and Idaho. Somewhere around a third of customers lost power in the central Puget Sound area including Seattle, Tacoma, and Everett.
In comparison, the famous 2006 Hanukkah Eve windstorm knocked out power to ~1.8 million customers. Although this storm was not at the level of our most famous PNW windstorms, it was quite the sneak attack.
Why was there almost no advance warning?
The NWS Seattle office, which has done an amazing job at forecasting a wide array of weather hazards over the past several weeks, issued a wind advisory around 8 PM Tuesday night, giving just three hours of warning prior to the strong winds approaching.
In an era where weather models often give 5+ days of advance warning for significant storms, the lack of at least a day or two of warning for a significant windstorm is quite shocking. The purpose of this post is to look at the following five reasons why this event snuck under the radar:
- Windstorm forecasting is a finicky business.
- The American weather models did not predict strong winds until 6 hours before the event.
- The heavy rain from the atmospheric river dominated the weather narrative.
- Soggy ground caused more tree damage than usual for 45-55 mph winds.
- The low formed relatively close to shore and continued to deepen after landfall.
Before I get into details, a couple of clarifying points. First, some people did recognize the threat of a windstorm several days in advance. In particular, Michael Snyder and Benjamin Jurkovich of Washington Weather Chasers did a great job communicating the slight but nonzero possibility of strong winds, which was advertised in some models (see point #2 below). That said, my main assertion here is that the official forecasts were entirely reasonable given the lack of strong wind gusts in most model guidance. As I describe below, several factors came together to deliver another memorable weather event from a winter that has been quite active already.
1. Windstorm forecasting is a finicky business
The number one reason why the windstorm snuck under the radar is that windstorm forecasting is extremely difficult. In the most basic sense, Puget Sound windstorms are a type of “gap wind” in which air accelerates as it is forced between two terrain features, in this case the Olympic and Cascade Mountains. Anyone who has experienced strong winds between skyscrapers in downtown Seattle has experienced this type of effect, albeit on a much smaller scale.
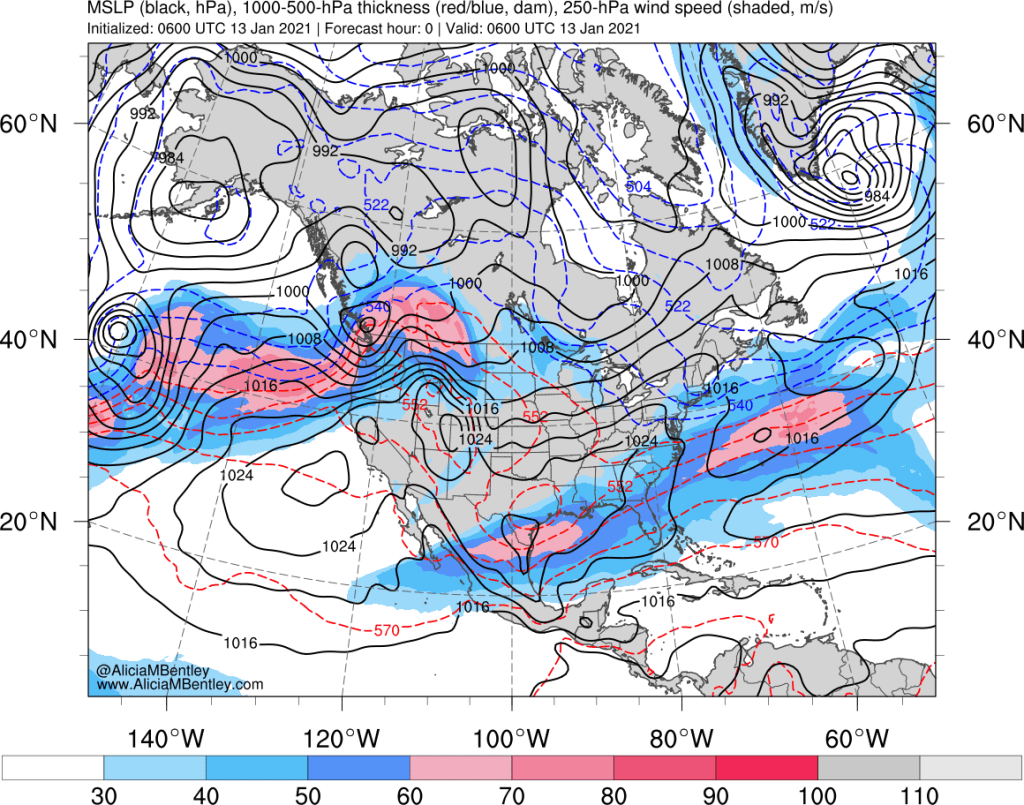
The stronger the pressure gradient through the gap, the greater the wind potential. A scenario like last night, pictured below, is favorable for strong winds as a low pressure center passed just north of Puget Sound with a fairly strong south-to-north pressure gradient within Puget Sound.
In this case, the low pressure center analyzed above was only 991 hPa. Memorable windstorms often have low pressure centers below 980, or even 970 hPa.
A ~990 hPa low can occasionally cause significant damaging winds, but there’s less room for error in the track (see #2) and some additional factors need to be in place (like soggy ground–see #4 and an intensifying storm–see #5).
2. The American weather models did not predict strong winds until 6 hours before the event.
Speaking of errors, the biggest problem with the forecasts for this event was that the American model, especially the GEFS ensemble, were adamant that the wind event would feature nothing worse than 30-40 mph gusts.
In contrast, early indications of a windstorm were noted by the European model (ECMWF) several days in advance, as Michael Snyder noted on Tuesday. However, the details were all over the place.
By Wednesday afternoon the European ensembles had much better agreement, with the ensemble low tracks (shown below) all across the southern tip of Vancouver Island and all generally in the upper 980s-low 990s hPa range.
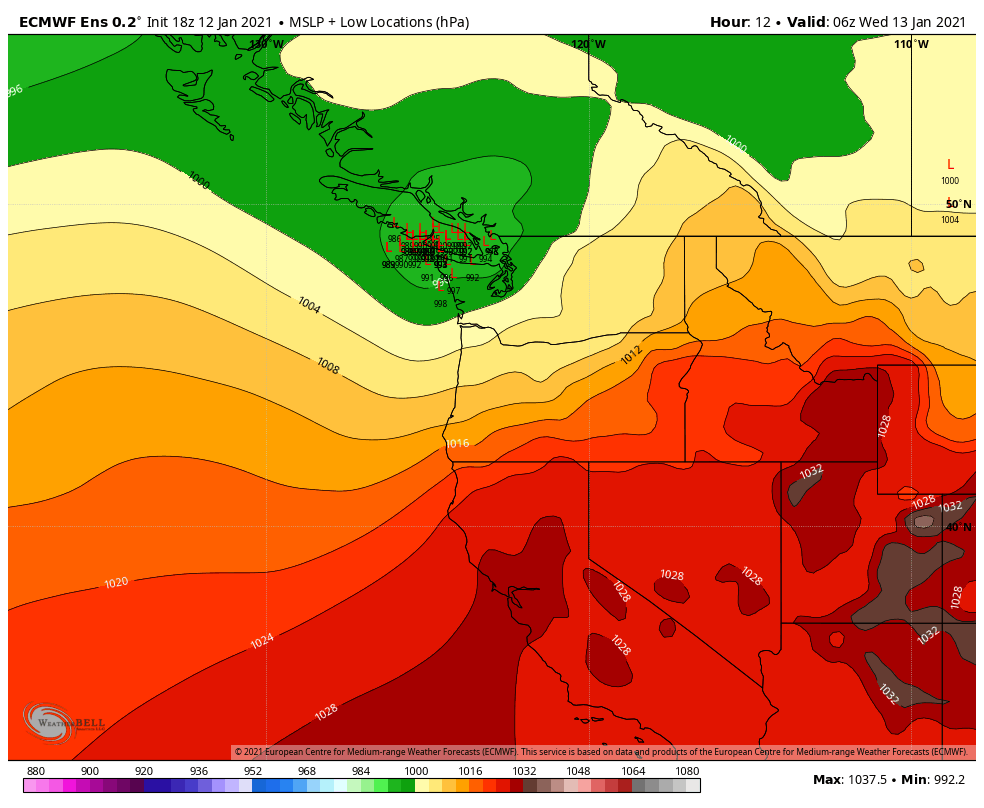
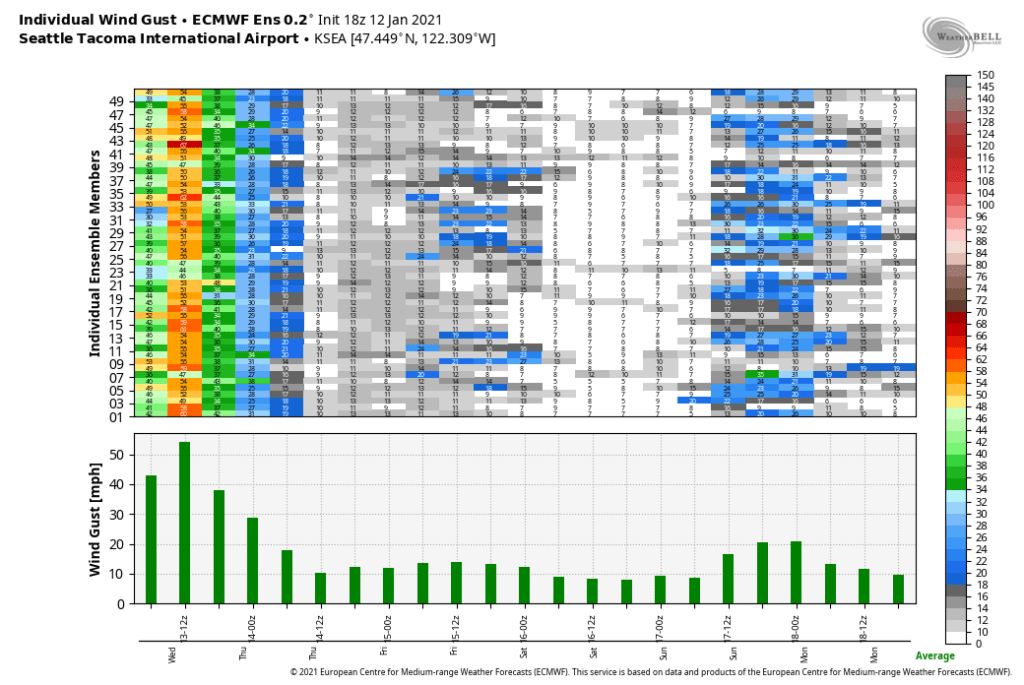
Consistent with the predicted low pressure position and strength, the ensemble max wind gusts for Sea-Tac airport were mostly in the low-50s mph range. This forecast for the overnight hours was nearly spot on, with high confidence, although earlier runs of the ECMWF also predicted a period strong winds for early morning Jan 12 that did not materialize.
How about the American GEFS model ensembles?
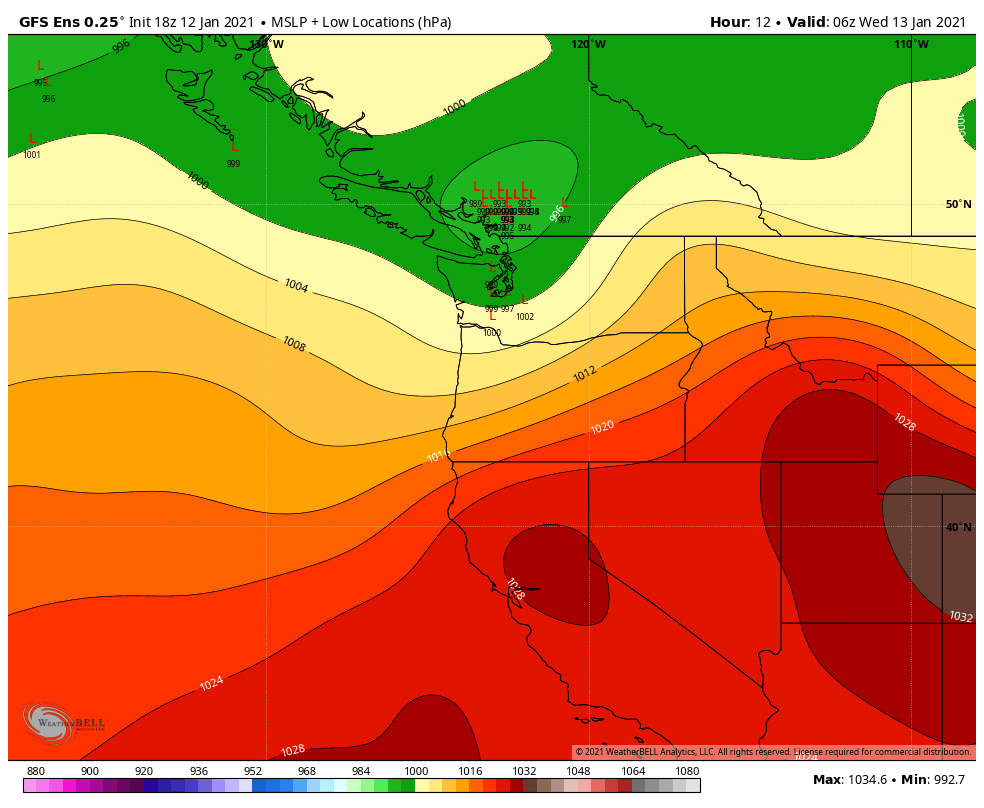
Slightly more spread than the ECMWF, but overall the GFS ensembles were in fairly good agreement. Unfortunately, ensemble agreement can be quite dangerous if all of the ensemble members are wrong. The GEFS members generally advertised the same track over the southern tip of Vancouver Island although slightly faster than the European ensemble members. However, a subtle yet important issue can be seen by zooming in closely. The minimum pressure was generally in the low-to-mid 990s hPa in most ensemble members.
In this particular storm, the relatively minor differences in track and intensity between the GFS and ECMWF turned out to be quite significant. WeatherBell does not output the max wind gusts from the GEFS ensembles, but the max wind gusts in the deterministic run tell the story. Maximum winds of only 30-40 mph were expected based on the higher minimum pressures shown in the GEFS ensembles.
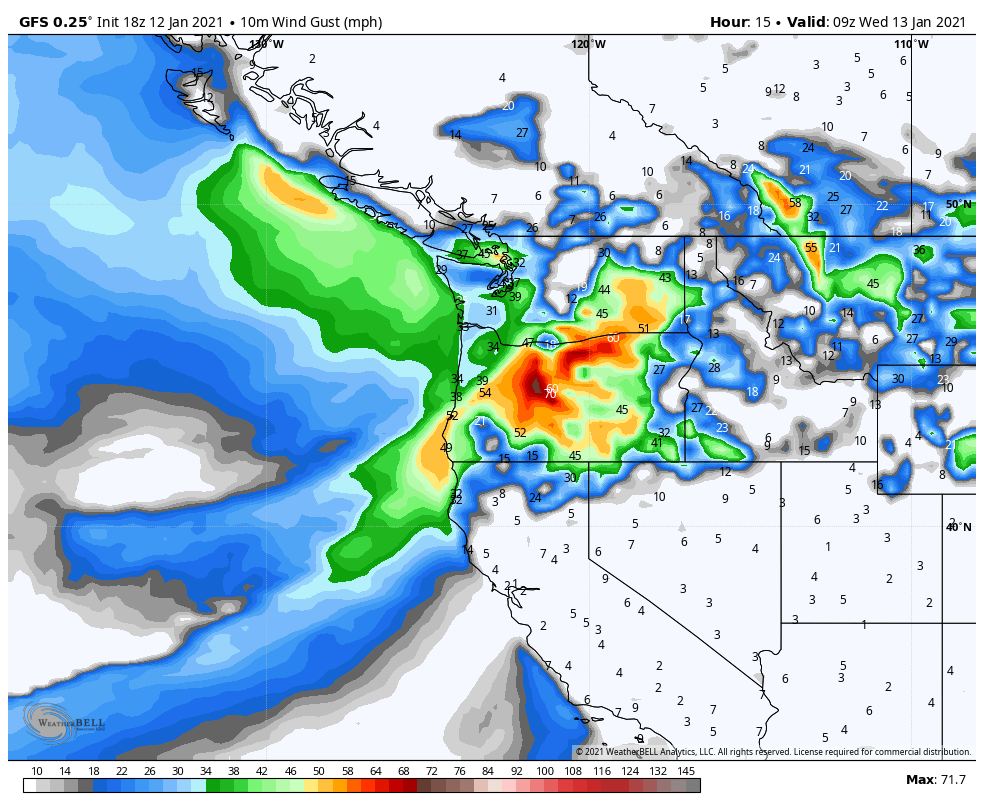
The high-resolution 1.33 km UW-WRF model, which is initialized with the GFS, had similar wind gusts in the 30-35 mph range with 40 mph at most in the most populated parts of central Puget Sound.
I focused on one model cycle above (18 UTC Tuesday), but a similar story can be found with most cycles leading up to this event. The European model and its ensembles advertised a likely windstorm and the GFS and its ensembles did not, with essentially no overlap. Other models, such as the NAM, were even less in favor of any significant wind.
While the ECMWF is statistically the best model overall, its performance in other significant PNW events this winter has not been noticeably better than any other model. So it is not surprising that professional meteorologists were skeptical of the ECMWF in this case, especially when there were plenty of other hazards to alert the public about. Which brings me to my third point…
3. The heavy rain from the atmospheric river dominated the weather narrative.
On Wednesday morning, NWS Seattle had 14 different hazard statements/advisories/warnings in effect including urban and river flooding in the lowlands, heavy snow in the mountains, avalanche risk from rain on top of the heavy snow, coastal flooding, and strong coastal winds.
Even without any strong winds in Puget Sound, this was already one of the strongest storms of the winter with a moisture fetch extending all the way to the central Pacific and several embedded waves which caused repeated bouts of moderate to heavy rainfall as they pushed inland.
Again, the lack of model consensus was the main reason why there little advance notice about a strong windstorm. Hypothetically, if it was a sunny day ahead of the windstorm and there was nothing else to talk about, I’m sure there would have been more written about the potential for strong winds on Tuesday night, even if the conclusion would still have been “too much uncertainty to know for sure”. Personally, I know I would have spent more time looking at the details in the models if I wasn’t watching the rain pile up.
4. Soggy ground caused more tree damage than usual for 45-55 mph winds.
Windstorms are remembered both for the strength of the winds and the damage they cause. Occasionally moderate windstorms cause damage that is disproportionate to their intensity. For example, the first windstorm of the season tends to be especially damaging, especially if leaves are still on the trees.
In this case, saturated soil from the onslaught of heavy rain over the first 12 days of January deserves some of the blame for the large number of uprooted trees in this event. Precipitation over the past two weeks exceeded all-time records in many places, or around 200-300% of normal in most of western Washington.

When the soil is soggy it is easier for the wind to uproot trees, which appeared to at least anecdotally to be the case from photos posted to Twitter.
Meteorologists were well-aware of the soggy soil threat and warned about the risk of fallen trees once it became apparent on early Tuesday evening that strong winds were increasingly likely.
5. The low formed relatively close to shore and continued to deepen after landfall.
The final reason is an important one, and helps to explain how an ensemble forecast system like the GEFS could completely miss the low development.
Check out the GFS model analysis from 18 UTC Tuesday, just over 12 hours prior to the windstorm. Do you see a low pressure center (closed black contours) approaching the Washington coast? No, because the low had not formed yet. A strong jet streak (which was responsible for the formation of the low) was approaching, but there is no low pressure center to be found.

12 hours later we ended up with a closed low in a perfect spot for a Puget Sound windstorm near the southern tip of Vancouver Island.
Since there was no surface low to track on Tuesday afternoon, satellite imagery provided the first indication that the European model forecasts were likely to verify.
The formation in the above image is a textbook “baroclinic leaf” signature of a developing cyclone. The name comes from the idea that the higher green/yellow cloud tops offshore resemble the shape of a plant leaf. A baroclinic leaf forms as a result of rising motion in the atmosphere creating clouds which are rapidly advected downstream by the strong jet stream. The low pressure center forms as a result of the rising motion. Recognition of this pattern by experienced meteorologists was a big reason why wind advisories were issued in the early evening.
Once the low started forming and could be initialized by the models, the high-resolution rapid refresh (HRRR) model started showing stronger winds. The two images below are maximum wind gusts for the same forecast time, 12-1 AM PST, but the forecasts were made 6 hours apart.
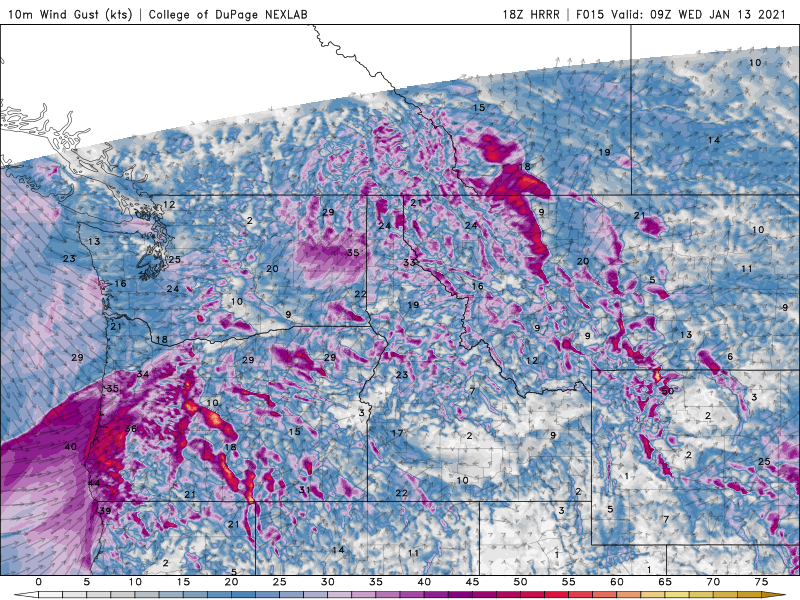
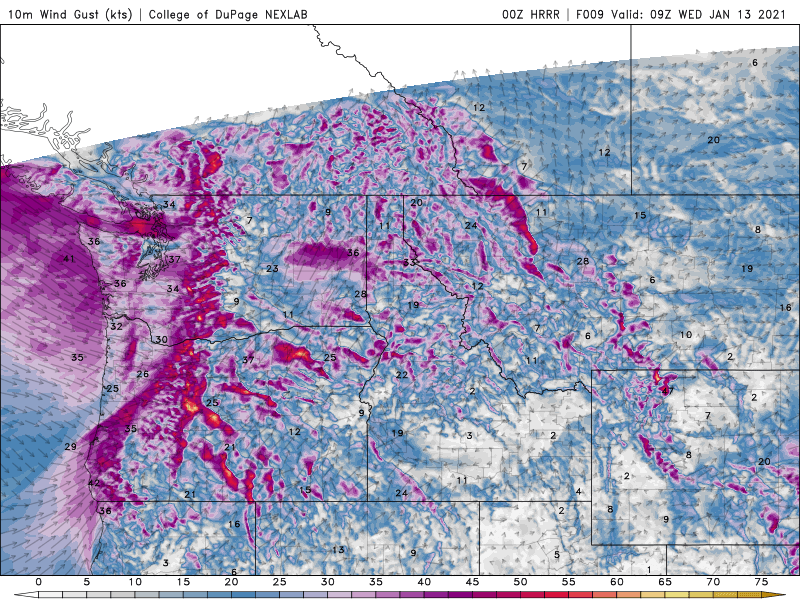
Wow, what a difference! From breezy but no big deal to widespread 35-45 mph wind gusts. And even the stronger HRRR forecast ended up being an underestimate of observed winds!
Continued deepening after landfall
Back under section #1 I showed the NOAA surface analysis with a 991 hPa low over the southern end of Vancouver Island at 10 PM PST Tuesday night. Three hours later the low deepened by an additional 3 hPa down to 988 hPa.
Deepening after landfall is somewhat unusual for PNW windstorms, as the low pressure centers usually form farther offshore and are already degrading (with increasing minimum pressure) by the time they move inland. There are a few reasons for this climatological pattern including the tendency of mountains to disrupt the deepening process and the climatological position of large-scale weather features such as the Aleutian low.
Since the pressure gradients across Puget Sound and the Strait of Juan de Fuca tend to be strongest after the low has already made landfall, a strengthening low moving inland is favorable for stronger-than-expected winds in interior portions of western Washington.
Another consequence of the strengthening low was that strong winds were also observed in eastern Washington and Idaho as the storm continued eastward.
One lingering question — why was the ECMWF so much better than the GFS in this case?
There are plenty of articles on the web about why the ECMWF is superior to the GFS when averaged over the long term. But each storm is different and occasionally the GFS wins out.
What is interesting about this particular windstorm is not necessarily that the GFS model failed to predict the strong winds, but that the ECMWF forecast was especially excellent. Given all of the challenges that I described associated with predicting a rapidly developing windstorm, it is kind of amazing how well the ECMWF performed at a time when the storm was merely an upper-level wave, over the ocean where there is little observational data. If I had to investigate further, the assimilation of satellite data over the ocean is where I would start.
