

The enormity of what the Pacific Northwest just experienced is difficult to put into words, but it is essential to at least attempt to contextualize what we just experienced and try to answer the #1 burning question on everyone’s mind — what role is climate change playing in PNW heat waves?
First of all, it is indisputable that summertime temperatures are increasing in the PNW and the number of hot days (e.g. 90+°F) is increasing in most places. Even so, the June 2021 heat wave was truly on another scale, beyond the limits of what many of us thought was possible in coastal portions of the Pacific Northwest.
In this post, I review some of the significant historical records from the recent heat wave, examine the relationship between climate change and increasing summer high temperatures in the PNW, and outline some meteorological reasons why the June 2021 heat wave was unique and why it (hopefully) will not be repeated in the near future, even as the frequency and intensity of heat waves continues to increase across the globe.
How anomalous was this heat wave?
The majority of Washington and Oregon experienced all-time record warmth with all-time temperature records set at the majority of locations. The image below shows all-time records from Monday 6/28/2021, which does not include the coastal records from the day before or the interior records in eastern WA/OR the day after.
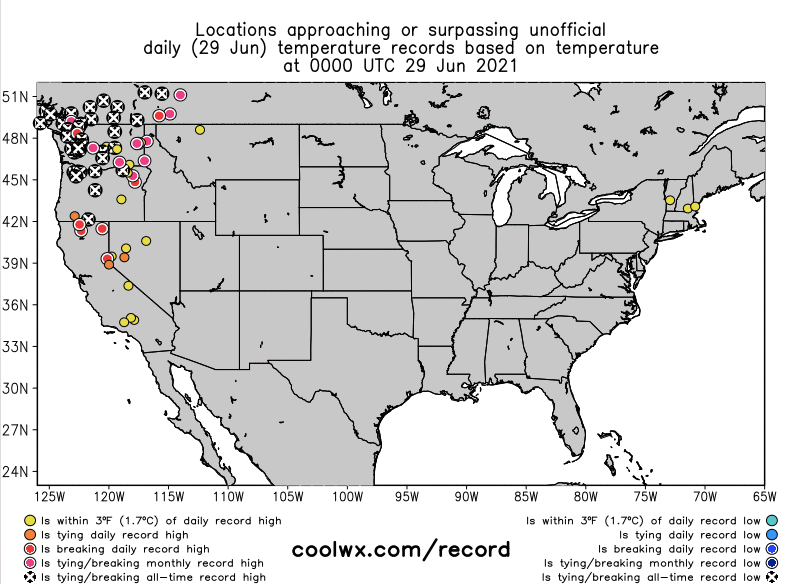
The most anomalous record of all was probably the 110° reading at Quillayute, Washington, which was 11°F above the previous all-time record.

Out of 5,401 weather stations in the US and Canada, not a single other station has as big of a gap between the #1 and #2 temperature records.
The temperatures were so high in many places that they would have smashed all-time climate records at most locations in the US. Portland’s new record of 116°F exceeds all-time records in most of Texas and New Mexico.
Canada’s new all-time temperature record of 49.6°C/121°F at Lytton BC has only ever been matched at the warmest spots in the desert southwest. To make matters worse, a wildfire tragically destroyed most of the town a few days after the record.
There were so many other significant weather occurrences related to the heat that the best I can do is list them below. Under normal circumstances, each of these might have been worthy of an entire blog post on its own.
- Dew points in the 80s near Lake Stevens, WA on Monday evening 6/28/2021.
- All-time record 850 hPa temperature at Quillayute, WA (29.2 °C).
- All-time warm low temperature records (e.g. 73 F at Sea-Tac airport).
- At least 63 deaths in Oregon may have been caused by the heatwave.
- Abnormally high surface ozone concentrations in portions of western Washington and BC.
- Wildfires break out in British Columbia.
- Damage to the cherry and apple crop in eastern Washington (as well as considerable damage to garden plants in western WA).
- The greatest 1-day temperature drop on record at Sea-Tac airport (46°F from Monday to Tuesday morning).
- Excellent performance by numerical weather models with up to 8-9 days of lead time.
To sum it all up, this heat wave fundamentally altered our understanding of what type of temperature extremes are even possible in the Pacific Northwest in the current climate. It also makes one wonder what is possible in future, warmer climates. If 116 is possible in Portland after +1 °C of global warming, will even greater extremes be possible at +2 or +3 °C? Or was this a one-off “black swan” heat wave that is unlikely to be repeated in the future?
Extreme events and climate change
Our confidence in attributing extreme weather to climate change depends on the type of weather, as some are more easily attributable to climate change than others. As the graph below illustrates, temperature extremes are the easiest type of weather event to attribute to climate change. (Note that the extreme cold bubble refers to a reduction in extreme cold events, not an increase.)

Wildfires, in comparison, are a more complicated extreme that are more difficult to direct attribute to climate change, mostly because other human-caused factors like land use management, firefighting, and urban sprawl are also important.
The impact of climate change on extreme heat events can be simply visualized by shifting the distribution of temperatures to the right, which leads to more hot weather and extreme heat.

The shift to the right can already be seen in real temperature data such as Seattle’s summertime high temperatures which are running 2°F warmer in the 21st Century compared to the 20th Century.

Seattle’s summer high temperatures are influenced somewhat by the urban heat island effect and the expansion of Sea-Tac airport, but also simply by being away from the Pacific Ocean. Still, the number of 75+°F days is clearly increasing at the expense of cooler days, as would be expected from shifting a distribution to the right.
Following the approach of Durran (2020), extreme events can be probabilistically attributed to climate change with fairly high confidence. And the more extreme the event, the more confident you can be about attributing it to climate change.
The (somewhat) good news is that the curve fitting approach suggests that an event this extreme will still be relatively rare as long as the amount of global warming stays modest. But — and this is a very important caveat — it does not account changes to the shape of the temperature distribution in the future. Some recent studies, such as one by Lucas Vargas Zeppetello at UW, suggest that increased drought will lead to a disproportionate increase in peak summer temperatures relative to the average.
What’s different about Quillayute?
If we apply the same curve-fitting approach at Quillayute, WA, which is close to the Pacific Ocean and surrounded by trees, there is much less of a climate signal in average summer high temperatures to date.

The two distributions are basically the same, except for the ~60% increase in 90°F+ days in the last two decades. Which certainly could be a result of a change in temperature variability, even if the mean has not changed.
As for the 110°F reading at Quillayute, it is so insanely outside of the bounds of historical summer high temperatures (6 standard deviations) that it’s hard to make any definitive statement about whether we’ll see 110° again at Quillayute in the near future.
What we can more confidently say is that as of 2021, climate change is increasing average summer temperatures in the western US and that the extremes are generally getting warmer roughly in proportion with the increase in the mean. Climatologist Brian Brettschneider put together a nice map showing the increase in 99th percentile summer high temperatures, which is increasing in most places except the Midwest (a result of irrigated agriculture).
Irrigation from the Columbia River Project is also responsible for somewhat reducing the increase in summer temperatures in eastern Washington, although the irrigation started around 1950 so it is not captured by the above map.
What’s important here is that context matters — especially in a place like the Pacific Northwest that has complex terrain and a variety of microclimates.
The biggest ridge in recorded PNW history
From a meteorological perspective, the key to making sense of the heat wave is by looking at the enormous upper-level ridge, commonly referred to as a “heat dome” because of how the pressure surfaces in the upper atmosphere are altered by a circular-shaped ridge of high pressure.

The massive size, extent, and duration of the ridge resulted in air that was originally over the Pacific Ocean taking a week-long trajectory through British Columbia, where it was heated over terrain and then rapidly descended and warmed as it approached the western Washington directly from the east.

Most importantly, the approach of the airmass from the east prevented the cool, marine air over the Pacific from appreciably reducing the extent and intensity of the heat in coastal WA and OR.
In comparison, trajectories from Seattle’s previous top heat wave, July 27-29, 2009, show a much shorter trajectory over land and an approach from the north-northeast. In that event, Qulllayute failed to reach 90°F despite a high of 103°F in Seattle.

So the size and extent of the ridge was undoubtedly the key to getting up to 110°F at Quillayute, not only holding off the marine push but also adding additional heating through easterly downslope warming.
Are PNW ridges increasing in intensity?
To contextualize the recent record-breaking ridge, I downloaded a 50+ year record of summer upper-air data at Quillayute. The height of the 500 hPa pressure level (which is proportional to the average temperature of the lower atmosphere) broke an all-time record at Quillayute during the heat wave.

Fortunately, the recent event appears to be more of a blip than a trend, at least so far. The maximum and 95th percentile ridges are essentially unchanged through the 50-year record.
However, the 850 hPa temperature (approx. 5,000 ft elevation) does have a warming trend consistent with climate change (+ 1 °C since the 1980s). The recent 2021 event is unprecedented to an absurd extent.

The 95th percentile 850 hPa temperature events (18.5°C or greater) are increasing at a rapid pace.

It’s not surprising that the “curve fitting” approach does show warming at 850 hPa (5,000 ft above the ground) at Quillayute during the summer, even if it isn’t showing up in surface high temperatures.

So what are we seeing here? Why is Quillayute not seeing more extreme high temperatures in the summer, even though it is warming aloft and nearby places like Seattle are seeing considerable warming?
The answer likely has to do with the cool, marine air that is constantly lurking just offshore, even on our warmest summer days. Because the land gets hotter than the ocean during the summer months, a pressure differential is created between the PNW and the Pacific Ocean. As illustrated in an article by Scott Sistek, there is always a tendency for marine air to push inland on warm summer days, although it usually takes until the overnight hours to reach the Seattle area.

As the climate warms the land faster than the ocean, it follows that the onshore pressure gradient should increase and marine pushes will continue to offset heat waves. I think this is what we are already seeing in the historical data at Quillayute. In the absence of a mega-ridge like the one we just experienced, coastal Washington will probably not experience another 110°F day.
How much will marine pushes offset PNW heatwaves as the planet continues to warm?
The role of marine pushes in offsetting heatwaves is an important research topic that deserves further scrutiny through the use of high-resolution regional climate models and idealized experiments. Some of these are already underway, as Cliff Mass has described in his recent blog post.
I’ll leave it to the reader to weigh the arguments and decide their own perspective on the climate change – 2021 heat wave connections, but it does appear that the underlying meteorology of the recent heat wave was unique and unlikely to be repeated in the PNW in the near future.
What I have tried to emphasize in this post is that every future heat wave will be slightly worse because of climate change. And the cumulative effect of that slight increase in temperature, combined with other human-caused changes to the environment, is how significant crises like repeated record wildfire seasons are created. So even if the geography of the PNW helps mitigate heat waves to some extent, there are plenty of other climate-related crises to contend with.

How would you compare your analysis to that set forth in recently-released multi-author rapid attribution study on this same topic? While the specific mechanics of how global warming led or contributed to the magnitude of this event may be hard to discern or quantify at this time (there is a reference in the study to “uncharted territory”), the rapid attribution study appears to be fairly strong in its conclusion that an event of this magnitude would be impossible without global warming. The extent of the event was far beyond an increase of 2 degrees F. You use the terms “unlikely” and “probably not” to say there will not be a repeat, but the question is will be heat events that go considerably beyond 2 degree increases. While “black swan” events are not unheard of in the stock market and politics, that term is rarely applied in science. About the only “black swan” event of a scientific nature that comes to my mind is the big bang. In most cases, “black swan” is simply another way of saying we don’t understand or have poor prediction tools.
Click to access NW-US-extreme-heat-2021-scientific-report-WWA.pdf
https://www.worldweatherattribution.org/western-north-american-extreme-heat-virtually-impossible-without-human-caused-climate-change/
LikeLike
I thought their analysis basically in line with mine…same idea–fit GEV curve to observations and try to think about what will happen if you shift the mean. So you can estimate return intervals but they are pretty rough guesses and are more for illustrative purposes than scientifically-based decision making. I do think “black swan” is appropriate here because as the rapid attribution study shows there are difficulties in modeling these extreme temperature events and although we can be quite confident about an increased frequency in a warmer climate we really don’t have much confidence in what the return interval would be. It’s a good challenge for the atmospheric science community to get better at estimating.
LikeLike
This event was predicted and talked about a number of weeks in advance. That really does not sound like a Black Swan. Typically a Black Swan lands without any warning and is a total surprise because people have no understanding of what is happening.
I would call your attention to the part of the paper’s summary quoted below, particularly the last sentence. We don’t have that far to go to reach 2°C. This seems to illustrate how non-linear all of this may be. The authors candidly state that we are in uncharted territory and it is difficult to get a definitive quantitative probability assessment at this time. From a risk management standpoint, we have a huge amount of downside risk from extreme heat events. I don’t think you can take this recent Northwest event in isolation. Just look to Oregon and California today or Siberia a year ago. The idea that global warming will just make the PNW a more pleasant place to live with a longer growing season seems like wishful thinking.
“● With this assumption and combining the results from the analysis of climate
models and weather observations, an event, defined as daily maximum
temperatures (TXx) in the heatwave region, as rare as 1 in a 1000 years would
have been at least 150 times rarer without human-induced climate change.
“● Also, this heatwave was about 2°C hotter than it would have been if it had
occurred at the beginning of the industrial revolution (when global mean
temperatures were 1.2°C cooler than today).
“● Looking into the future, in a world with 2°C of global warming (0.8°C warmer than
today which at current emission levels would be reached as early as the 2040s ),
this event would have been another degree hotter. An event like this — currently
estimated to occur only once every 1000 years, would occur roughly every 5 to
10 years in that future world with 2°C of global warming.”
LikeLike
On “black swan” I think we’re just debating semantics. It’s an extremely rare event that is made more likely by climate change. That’s well established. The question — how much more likely with 2 C of warning? That’s tricky. A 5-10 year return period would be extreme. Certainly that’s the conclusion of the rapid assessment report, but it’s not peer reviewed and based on climate models with a wide range of uncertainties. I’m also basing my analysis on the 6-sigma/110 F reading at Quillayute which is the most extreme value of the extreme event. If you used a threshold like 105 F in Seattle I think the 5-10 year return period might be more reasonable.
LikeLike