

If one was going to pick a date for the official start of 2021-22 rainy season, September 26 would probably be the date to choose. Yes, there was one storm in mid-September, but the consistent rainy weather started on the 26th and hasn’t let up since. There have not been more than 2 consecutive dry days in Seattle since in the past 48 days and over a foot of rain has fallen at Sea-Tac airport.
In addition, the PNW is currently being impacted by a series of storm systems along a persistent atmospheric river. So the rainfall numbers reported in this blog post will look even more impressive by the time things finally clear out next Tuesday.
Historical context
Precipitation in the western US is usually measured in terms of the “water year” which begins on October 1. As of midday on November 12, Seattle ranked #3 (out of 127 years) with over 10 inches of rain and counting since October 1.

The #1 and #2 ranked years, 2006-07 and 2016-17, both finished in the top-10. The rains of November 2006 caused significant flooding in Mt Rainier National Park. October 2016 was Seattle’s wettest October on record.
Quillayute airport (near Forks, WA) is also ranked #3, although with a shorter period of record. It would be a tall order to catch the record-breaking year of 1975-76.

Most of western WA and OR are running 150-200% of average precipitation over the past two months. The anomalies are even greater in northern California from the major storm a few weeks ago.
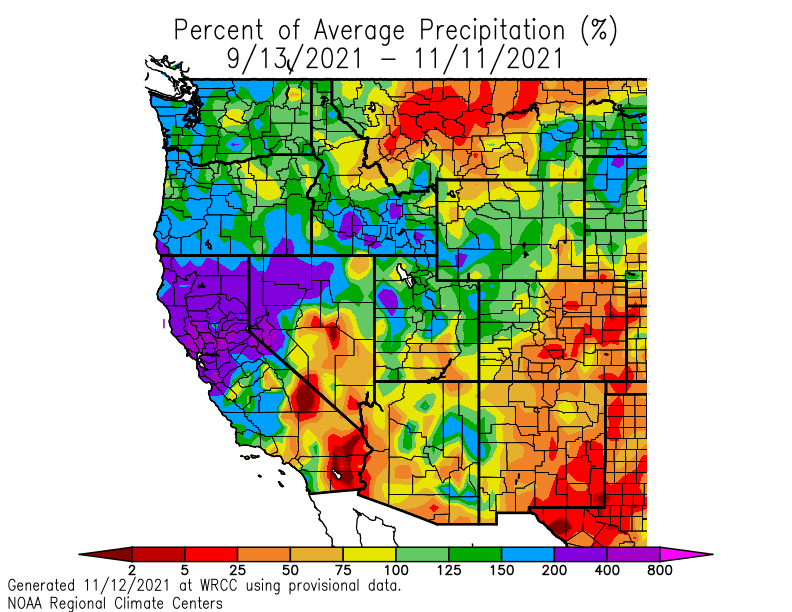
The above map will likely look even more blue and purple after the current and following storms are fully added in. It would be nice to see greater positive anomalies in eastern WA and OR.
A long duration atmospheric river
Currently the region is experiencing a series of storm systems which are all moving along the same atmospheric river.
Precipitation totals from the first storm (as of noon PST on November 12) have been impressive, both in the usual spots in western Washington as well as across the interior PNW.

Much attention has been given to the Snoqualmie River, which is expected to reach major flood stage by Friday evening. Fortunately, river levels appear to be running below the forecast.

The river forecasts also show a second spike from Sunday into Tuesday as the atmospheric river (AR) is once again expected to be aimed at the PNW.
The GIF below shows model forecasted precipitable water (essentially the moisture content of the lower atmosphere) from Thursday (yesterday) evening through Monday evening. Notably, all of these storms are tapping into the same plume of moisture which extends from Hawaii to the PNW.
There are several distinct “waves” along the AR over this time period, each of which is associated with a weather system that acts to consolidate and accelerate the moisture plume in different ways.
Another way to look at the evolution of the AR is through the integrated vapor transport (IVT) time series plots from the California CW3E group. Think of the numbers below as the horizontal flux of moisture reaching the Pacific coast near Hoquiam, WA — which is greatest for time periods when there is both high moisture content and strong low-level winds.
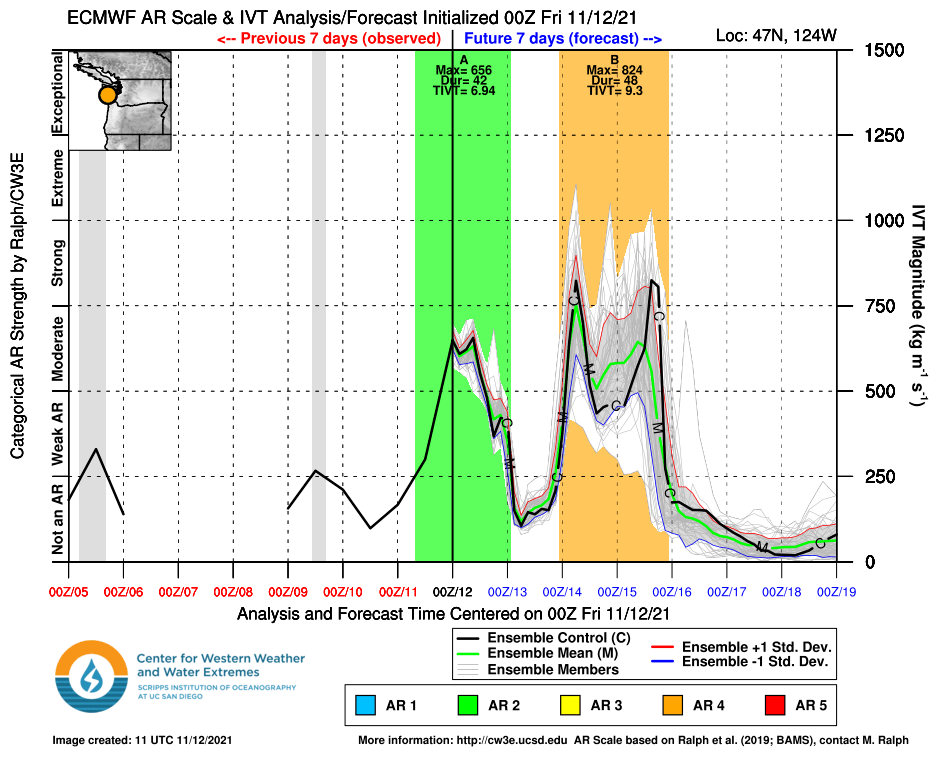
The ongoing stormy period (light green area) is peaking in the “moderate” category which the upcoming stormy period on Sun-Mon (orange area) is expected to peak twice in the “strong” category. The Sun-Mon event is given a higher “AR 4” rating as a result of both the greater intensity and longer duration of the AR in that period.
Why does this atmospheric river seem to be stuck in place? The answer is easiest to understand by remembering that atmospheric rivers are simply a component of the larger-scale cyclones and fronts that bring us all of our weather.
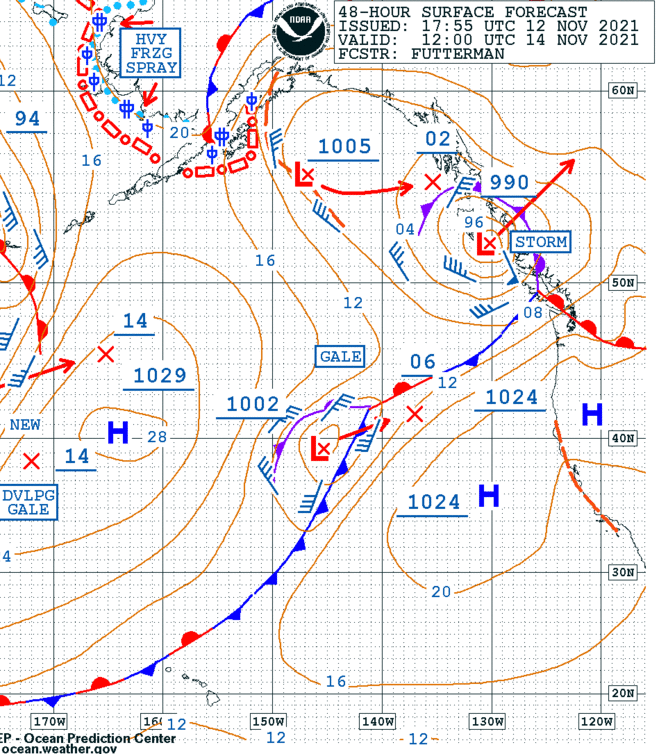
The surface forecast from NOAA’s Ocean Prediction Center for Sunday morning shows the key features. A frontal boundary will remain nearly-stationary from Hawaii to the PNW. Cold air is located to the NW of the front and warm, moist air (along with the atmospheric river) is to the SE. High pressure on either side of the front is keeping it locked in place. The low pressure system making landfall north of Vancouver Island will be responsible for increasing the intensity of the atmospheric river on Sunday. The second area of low pressure near 40°N, 140°W, will follow right behind it, further channeling and intensifying the surge of moisture associated with the AR.
Another way to visualize the frontal boundary is to simply look at the 850 hPa temperature (near 5,000 ft above ground) on Monday morning. The frontal boundary that the storms are following is easy to see.

Forecast precipitation totals are impressive on both Sunday and Monday. The first image below shows the ECMWF forecast amounts from Saturday evening through 4 PM Sunday. The second image is from 4 PM Sunday – 4 PM Monday.
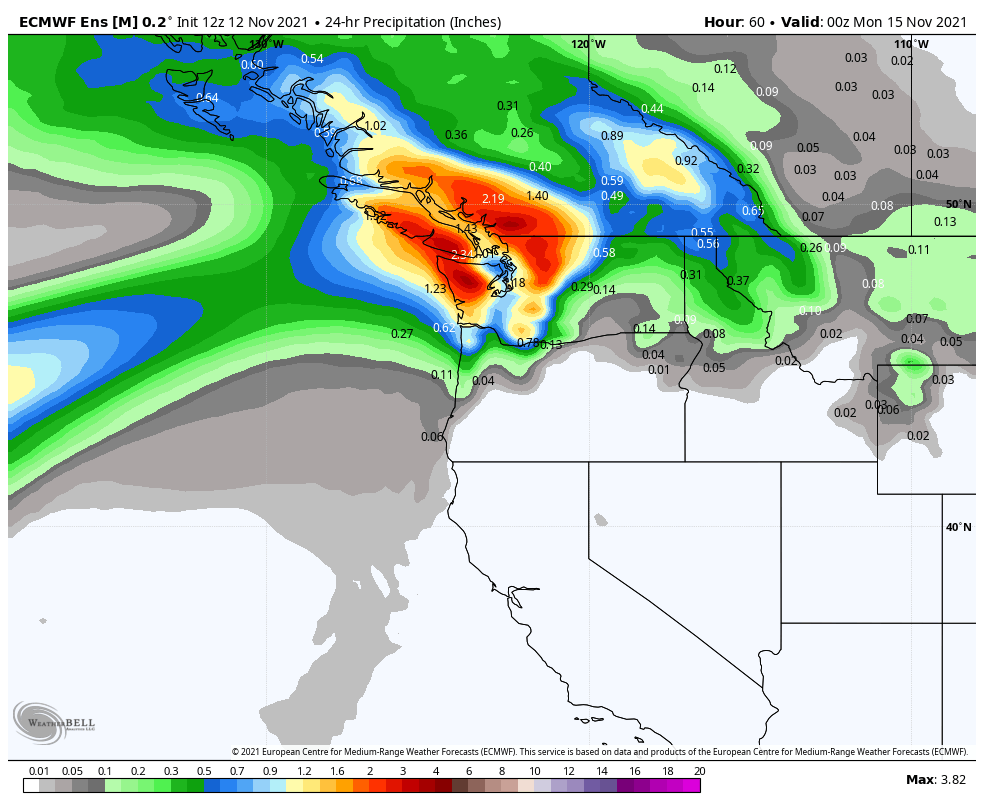
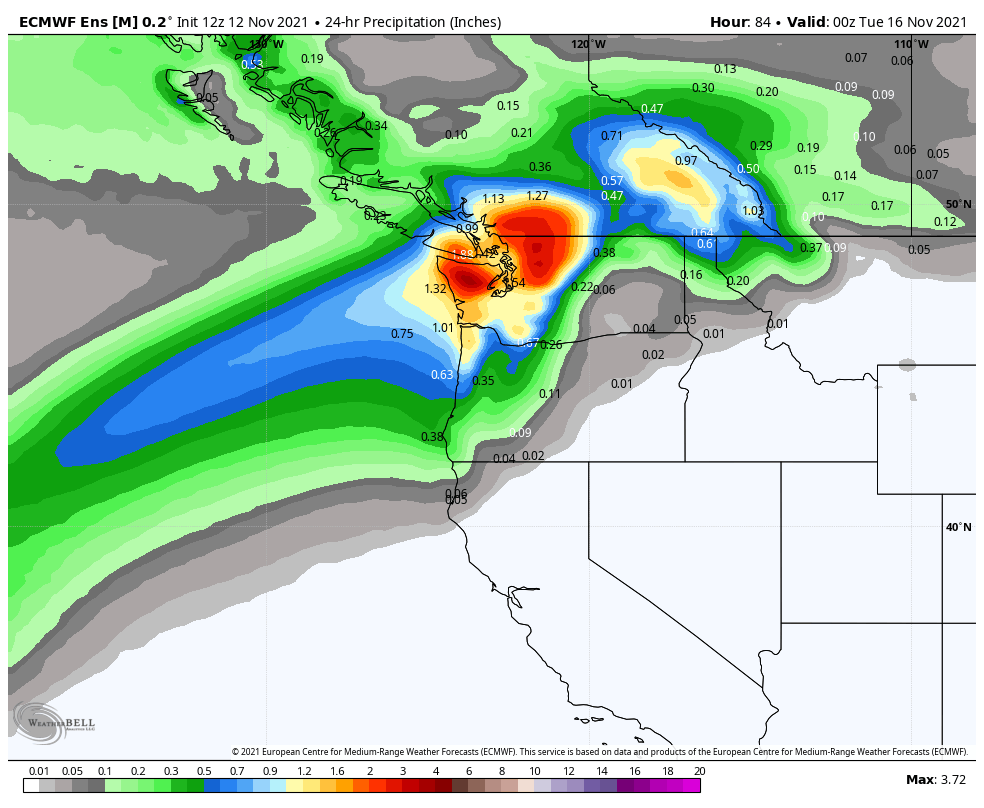
Sunday’s activity will be a bit farther north than Monday, although the Olympics and North Cascades will get significant precipitation on both days. There is also still a bit of uncertainty about the exact location of the heaviest precipitation.
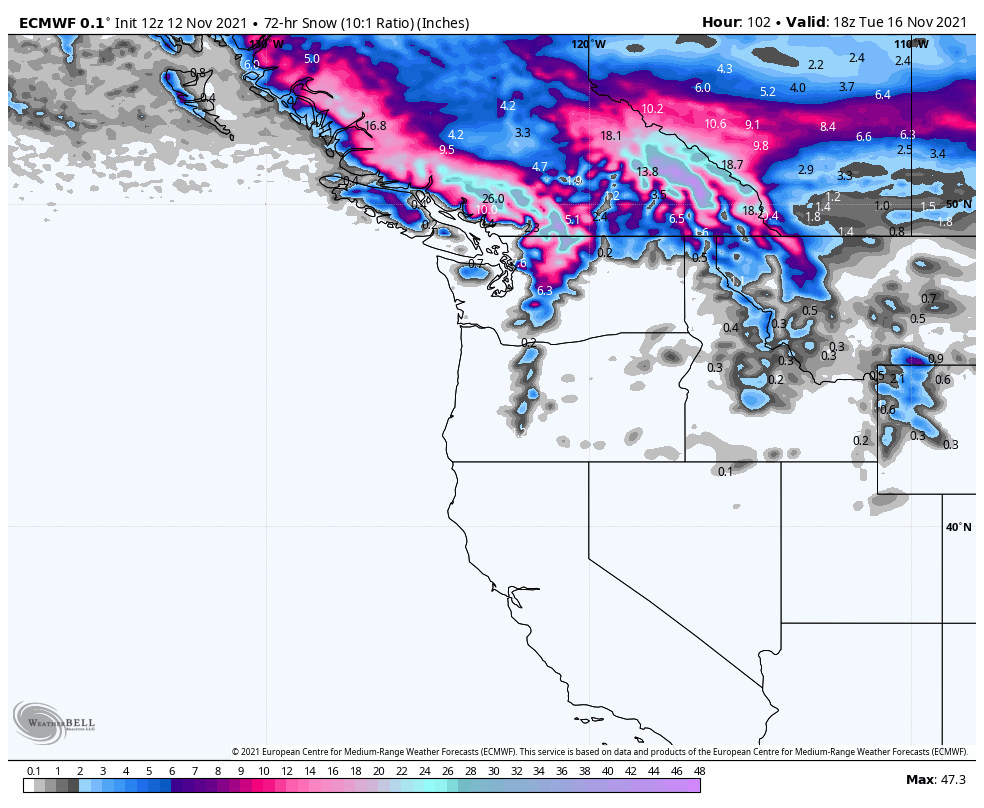
As the front finally moves south on Monday evening, snow levels will begin to drop. The snowfall forecasted below will mostly fall Monday afternoon into Tuesday in Washington. Huge snowfall totals are expected in Canada as a result of colder temperatures farther north.
Looking farther ahead
The PNW will finally see an extended dry (but chilly) period beginning Tuesday as the front pushes southeast and colder air moves in. Rain and mountain snow is likely to return by Thanksgiving week, although nothing looks especially intense at the moment.
