

As detailed in yesterday’s blog post, portions of western Washington face the prospect of serious flooding as an intense atmospheric river impacts the region. Significant rainfall is virtually locked in for the Olympics, North Cascades and Whatcom county. Areas to the south, including the Seattle metro area, are in a zone of uncertainty where the boundary between serious flooding event and non-event could end up being 10-20 miles.
Let’s take a look.
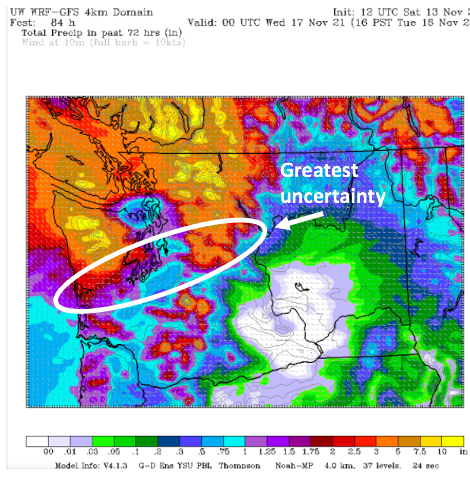
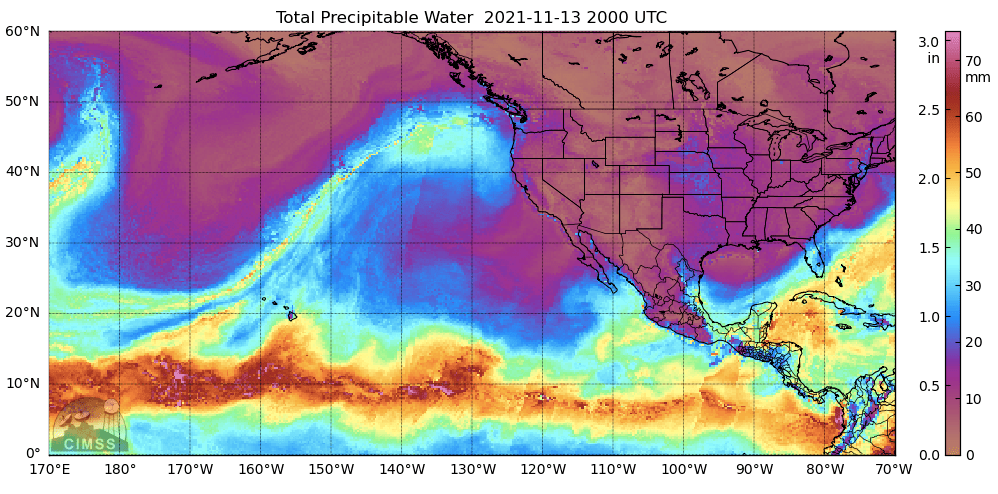
The area of greatest uncertainty is highlighted below in the latest UW-WRF total precipitation forecast. This map represents the more northern track, which would result in only an inch or inch and a half of rainfall around Seattle.
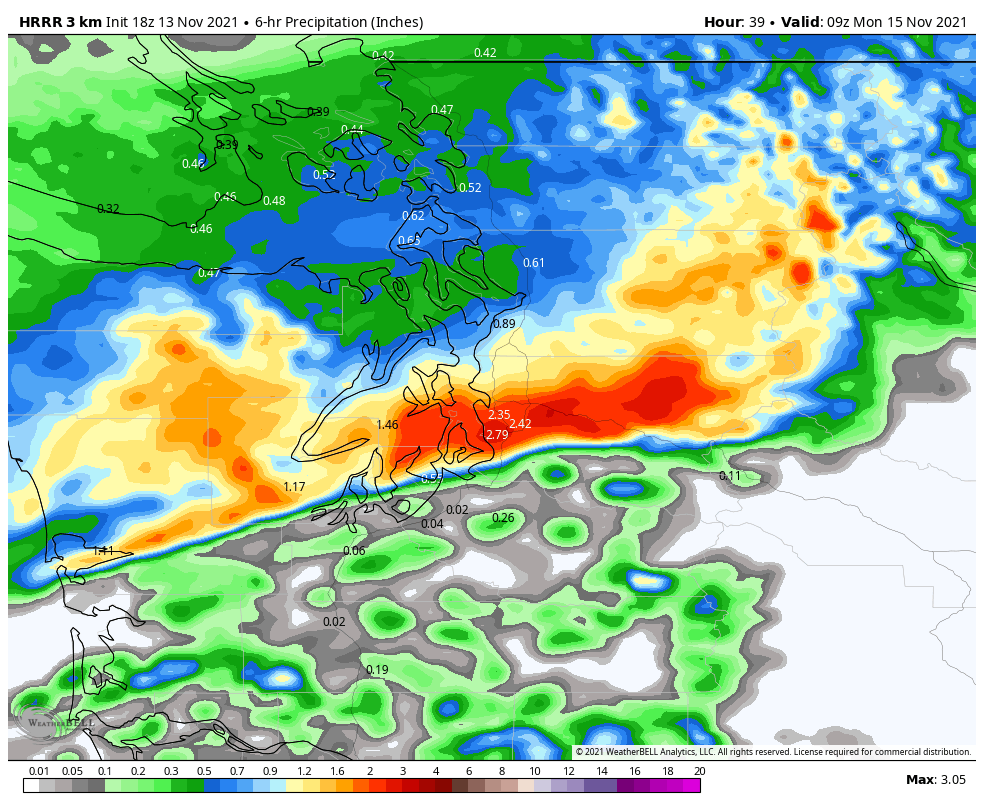
The latest HRRR model run shows the more serious scenario for Seattle, with 4-6 inches of rain in the lowlands and up to a foot of rain in the central Cascades.

A loop of the HRRR forecast radar reflectivity from Sunday afternoon – Monday shows why there is so much uncertainty.

The rain band is expected to have a sharp southern cutoff on Sunday evening. If the HRRR is correct, the 6-hour precipitation totals (ending 1 AM Monday) will be significant, with a ~10 mile wide band of 2-3 inches of rain in a short period of time.
Our infrastructure is not designed to handle that much rain in a short period of time. Sea-Tac only receives 2.5 inches of rain in a full day every couple of years. Getting that much in 6 hours or less would be a major problem for urban and small stream flooding.
Such a scenario is far from certain. The UW-WRF (initialized with the GFS model) shows almost no precipitation south of Whatcom County over the same time period.

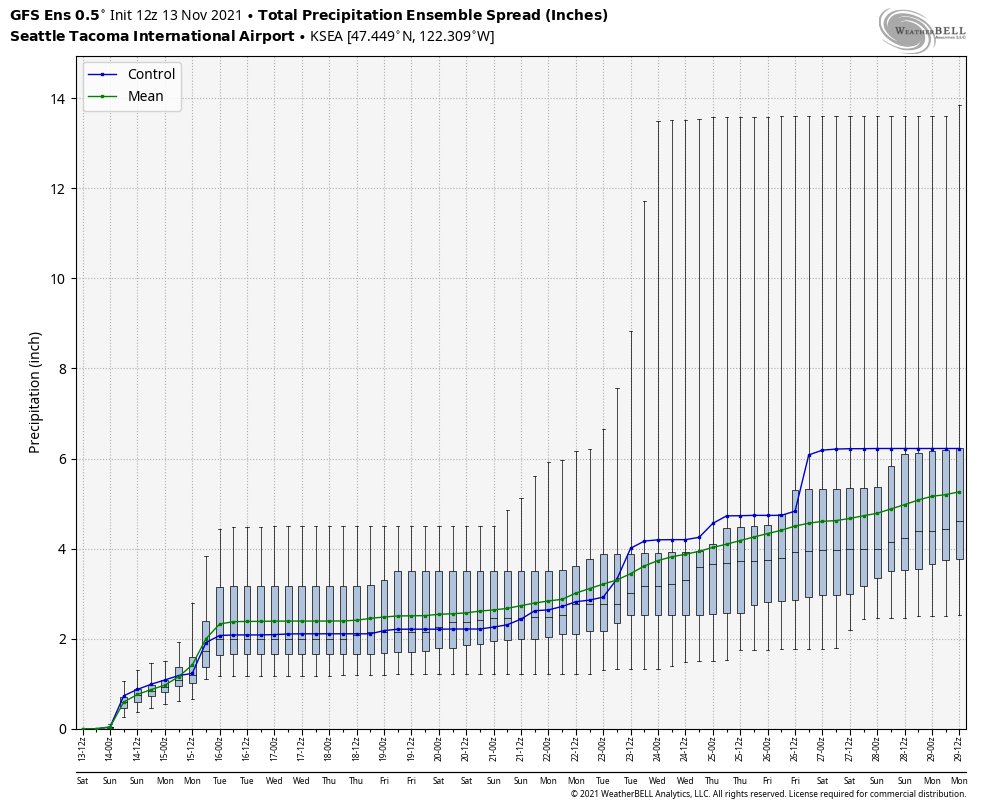
The error bars on the ECMWF precipitation forecast for Sea-Tac tell the story. The ensemble members are in fairly good agreement through Sunday afternoon. After that, the error bars show an ensemble mean of around 3 inches (still a significant rainfall event!) but the control run and some individual members are in the 4-6 inch range.

The GFS generally has lower precipitation amounts, around 2 inches at Sea-Tac.
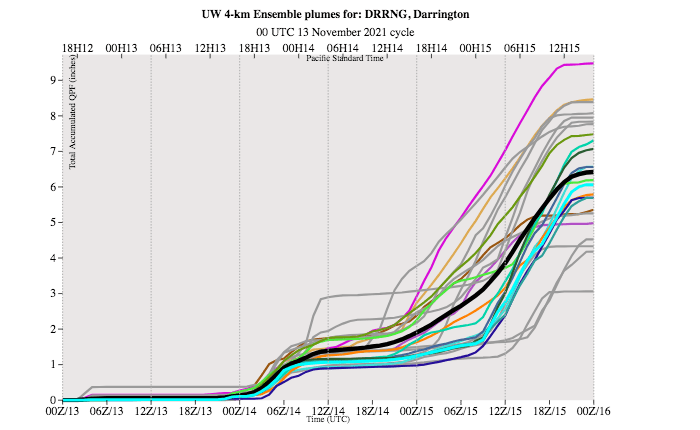
What about farther north? Here’s the UW-WRF ensemble plume for Darrington in Snohomish County. The ensemble mean is 6 inches of rain!
The Skagit river is currently expected to experience the most significant flooding of the event, with the river expected to rise well into major flooding stage on Monday morning. There is a history of crests in the 35-40 ft range at Concrete, but it has been 15 years since the river has exceeded 35 ft at this location.

Hopefully tonight’s model runs will bring a bit more confidence one way or the other. Meanwhile, the “finger” of moisture is once again pointing itself right at us.

Well, this certainly turned out to be a big mess up here in Bellingham. Fortunately for our household, we do not live close to any of the rivers and streams and our house is on high ground. Our property is not covered with impervious surfaces and it was designed with good drainage systems away from the house. I am a APRSWXNET/CWOP NWS reporting station and we reported about 4″ of rainfall during this period and about 6″ for November at this point.
I think it is worthwhile to consider how climate change can contribute to extreme events, often of an opposite nature, depending on the season. We came often a fairly extended drought in this part of the state and have received the opposite. The increased warmth in the entire system allows for more energy in weather events, so even though we are approaching winter, we are receiving tropical, moisture-laden air that ends up aimed right at us.
Looking at the Bellingham historical records, it is noteworthy that 1990 and 2021 produced back-to-back two day precipitation records. I do not know how long precipitation records for Bellingham have been kept, but only four of the record-for-the-day precipitation amounts were in the 1950’s. Most of these daily records are fairly recent periods. From an overall standpoint, it certainly does not look like a random distribution of unusual events in that only seven of the thirty daily records for November were set before 1980.
https://www.wrh.noaa.gov/climate/monthdisp.php?stn=KBLI&year=2021&mon=11&wfo=sew&p=temperature
LikeLike
There is strong agreement in climate models that hot/dry summers and warm/wet winters will be the general trend moving forward. It’s a big problem because the higher snow levels cause more runoff, although sometimes atmospheric rivers that come from a more westerly direction or later in the winter can be beneficial because the snow levels tend to be lower. To do a proper extreme weather study with observed data one would want to look regionally rather than a few specific sites.
LikeLike