

Yet another round of active weather is aimed at the Pacific Northwest beginning on Thanksgiving day and continuing into early December. Initially it will feel like déjà vu, with yet another 2- or 3-part “pineapple express” over Thanksgiving weekend.
As the calendar turns to December, the active weather is likely to continue but it will be accompanied by colder air that is currently located over Alaska and the far-north Pacific. Winter sports enthusiasts can look forward to significant snowfall in the mountains while lowland snow fans will at least have a reason to keep an eye on the forecast. Let’s take a look at the details.
More atmospheric rivers
The upper-level pattern over the last week has featured a series of weak ridges over the western US with cooler air bottled up near Alaska. By midday on Thursday (Thanksgiving), the pattern will have amplified, with a stronger trough present over Alaska and the western US ridge looking tilted like a bowling pin being knocked over by the low pressure system over Alaska.

That general pattern is expected to get stuck in place for the better part of the next week. Here’s the 7-day averaged anomaly (ECMWF ensemble mean).

Alaska will be stuck in a deep freeze. The forecast ridging over the PNW is stronger than one might expect given we are about to experience a stormy period. Washington state will be clipping the southern edge of the next stormy period, as seen by the 7-day precipitation anomalies below. Oregon and Northern California will avoid most of the action.

Obviously the above forecast is not a pretty picture for the areas that were just impacted by severe flooding.
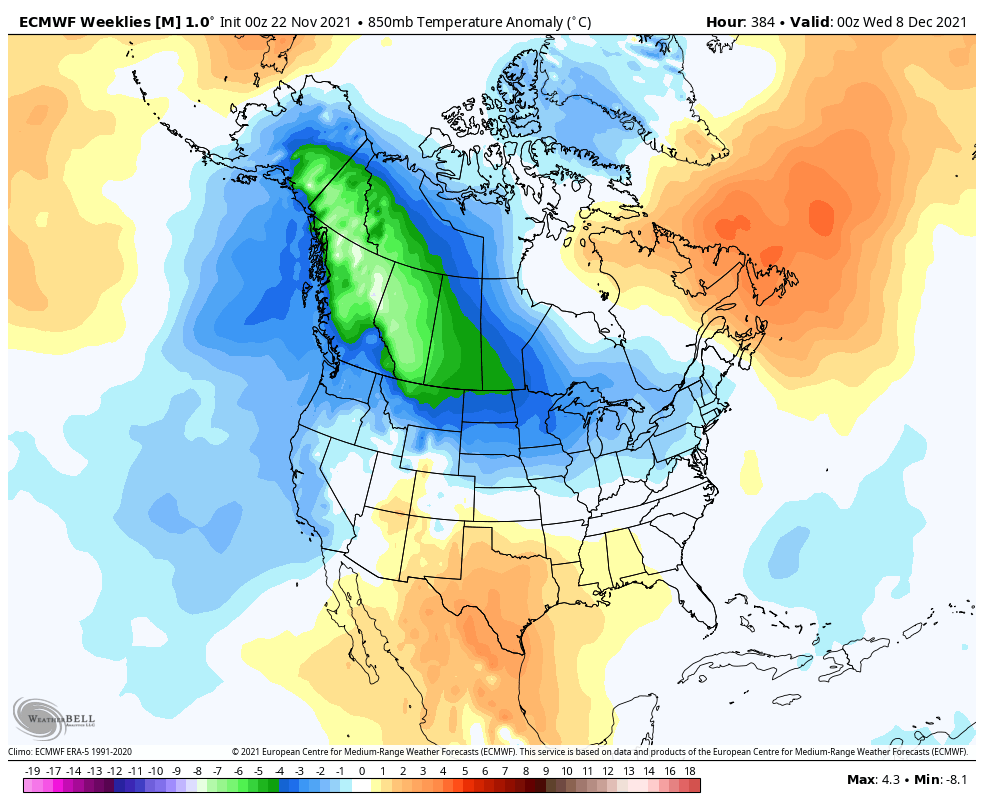
The temperature anomaly map for the next 5 days at 850 hPa (~5,000 ft) indicates that the upcoming stormy period will also be a warm one, with high snow levels and significant runoff.

A wide view of the entire north Pacific is needed to see the moisture source. A huge atmospheric river is organizing across many thousands of miles. The animation shows how a series of low pressure systems will once again concentrate water vapor into narrow bands directed at our region.

Based on these loops, I would not call this three separate atmospheric rivers, but rather three storms or waves along the same large-scale atmospheric river.
The 24 hour precip forecast at Quillayute on the Olympic Coast shows the three stormy periods — one on Thursday/Friday, a second from late Saturday into Sunday, and a third (with more uncertainty) from Tuesday into Wednesday of next week.
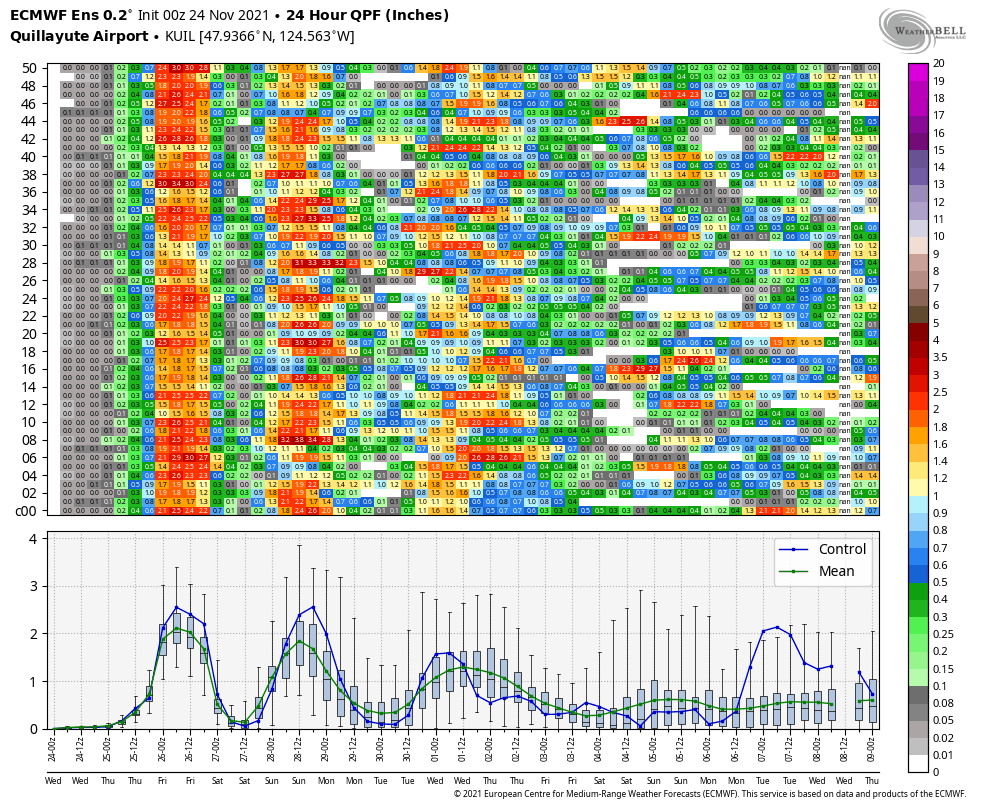
Quillayute is likely to see 6-8 inches of rain in the next week from this series of storms. While that may seem extreme, Quillayute recorded over 8 inches of rain in two days from the last series of damaging storms. So, thankfully, this round of storms is not quite as bad as the previous round in terms of expected rainfall. But it could still cause a number of problems given how saturated the soil is already.
The AR scale forecasts from CW3E are consistent with the rainfall forecasts. AR conditions are expected to peak at a ‘3’ on their AR scale, which factors in the intensity and duration of the atmospheric river. This scale does NOT consider the snow level or the existing soggy conditions. All of the following charts are for the GFS ensemble since the ECMWF plots were not updated.

The first stormy period on Thursday-Friday is a shorter-duration event rated as a ‘2’ while the second period from Saturday night into early next week is rated as a ‘3’. Note the increasing uncertainty (squiggly gray lines representing each ensemble member) as we move into early next week.
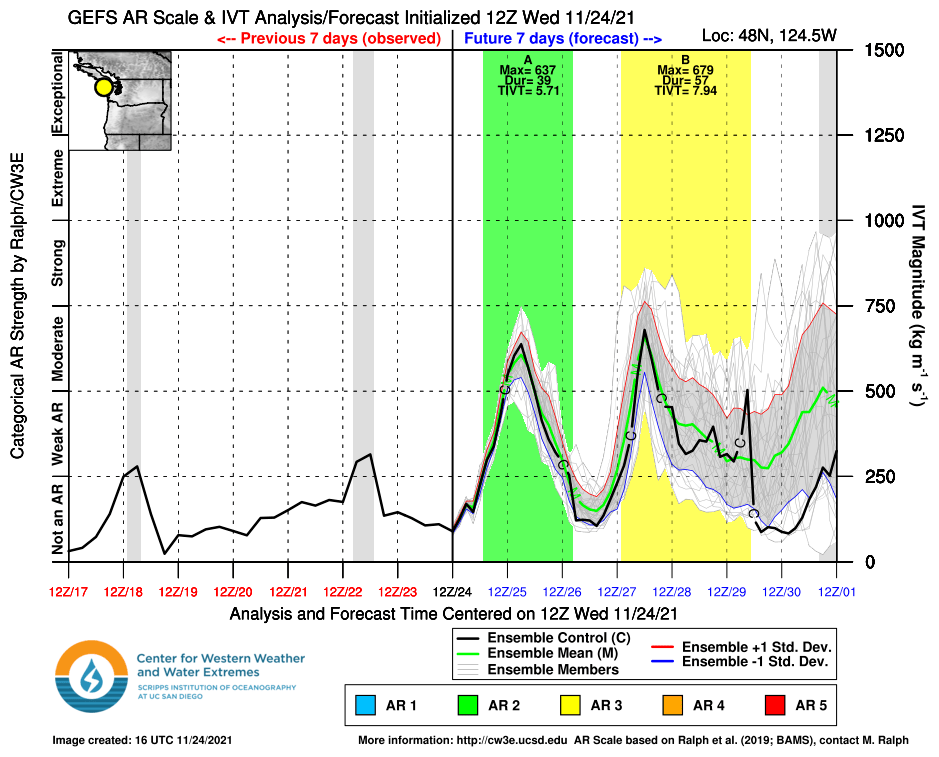
The longer duration of the second period is the main reason for the ‘3’ rating.

Best guess on total rainfall (ECMWF ensemble mean) through the end of November is generally in the 2-4 inch range in the lowlands and 6-8 inches in the mountains.
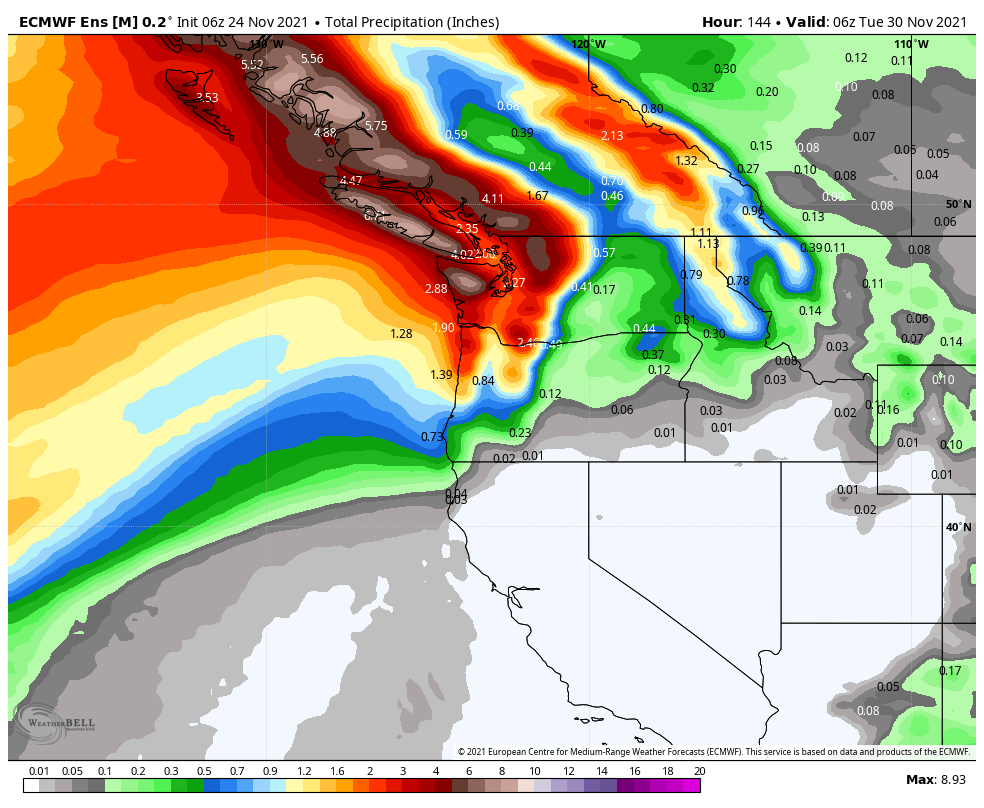
However — the ensemble mean plots are obscuring the uncertainty that often occurs with atmospheric rivers. The main corridor of moisture transport is usually narrow and tends to hit one or two river basins especially hard. As the second event nears we will have to look more closely at the mesoscale models to determine which areas might be near the higher end of the projected totals.
A cold blast to begin December?
Social media has already been full of suggestions that the PNW could see a blast of arctic air in early December. Let’s take a quick look.
The first thing we need for an arctic air outbreak is for there to be a source of arctic air. Here’s the actual 850 hPa temperature forecast (actual values, not anomalies) for Saturday afternoon. There will be plenty of arctic air in Alaska and NW Canada.
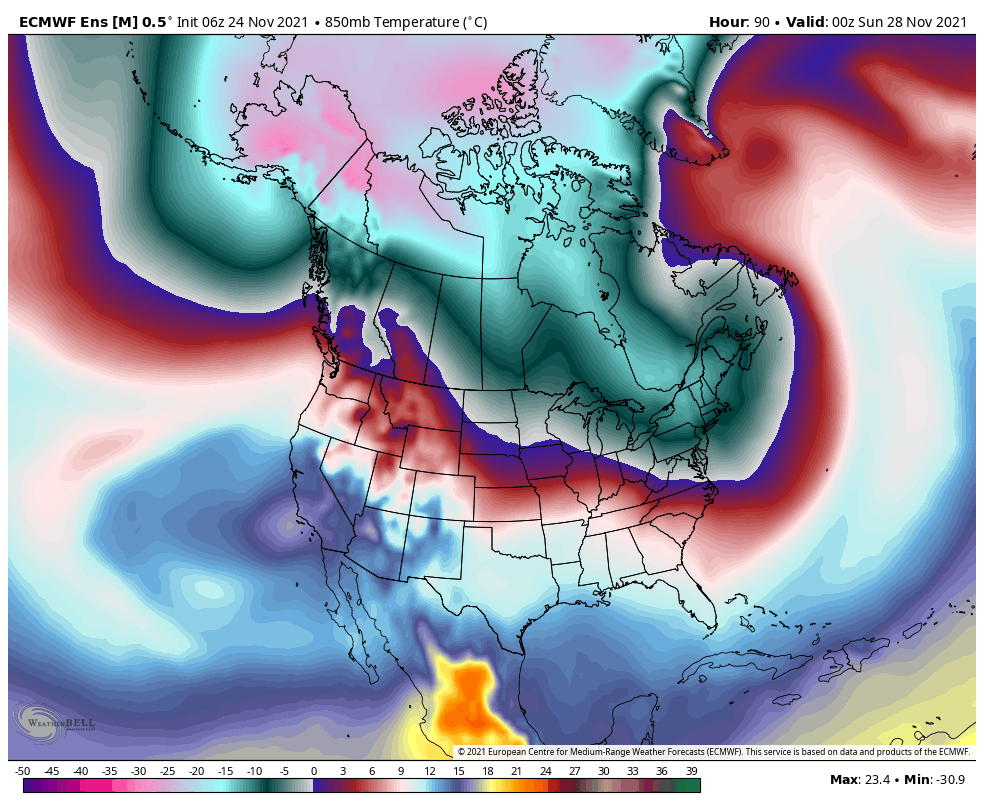
Alaska is often a source region for our arctic air outbreaks, but the key is getting a pathway for that arctic air down to the Pacific Northwest.
The latest ECMWF weeklies suggest that by about a week into December, the cold airmass will have moved south into BC and Alberta.
That’s one piece of the puzzle. It’s probably going to be chilly with low snow levels in early December.
In order for conditions to get truly cold near sea level, there needs to be a pathway for the arctic air to be pulled through the Cascades. Meteorologists often look for ridging to form over Alaska with subsequent troughing over western North America. If the pattern is too zonal (west-east), there will be too much maritime air around at the surface to support lowland snow.
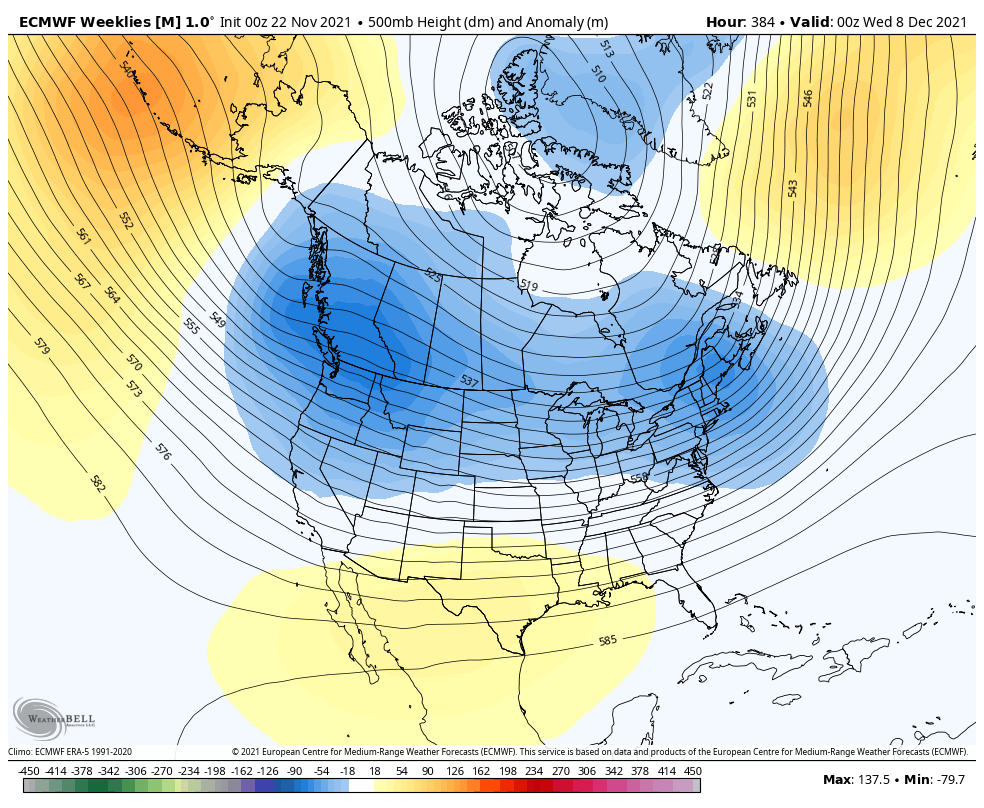
What do the models show? It’s a little too early to tell, but there is at least some indication of North Pacific ridging in the ECMWF weeklies and some trough formation over western North America.
Some of the other long range models have gone bananas with this pattern. Here’s the CFS height anomalies for the 7-day period starting the evening of December 4.
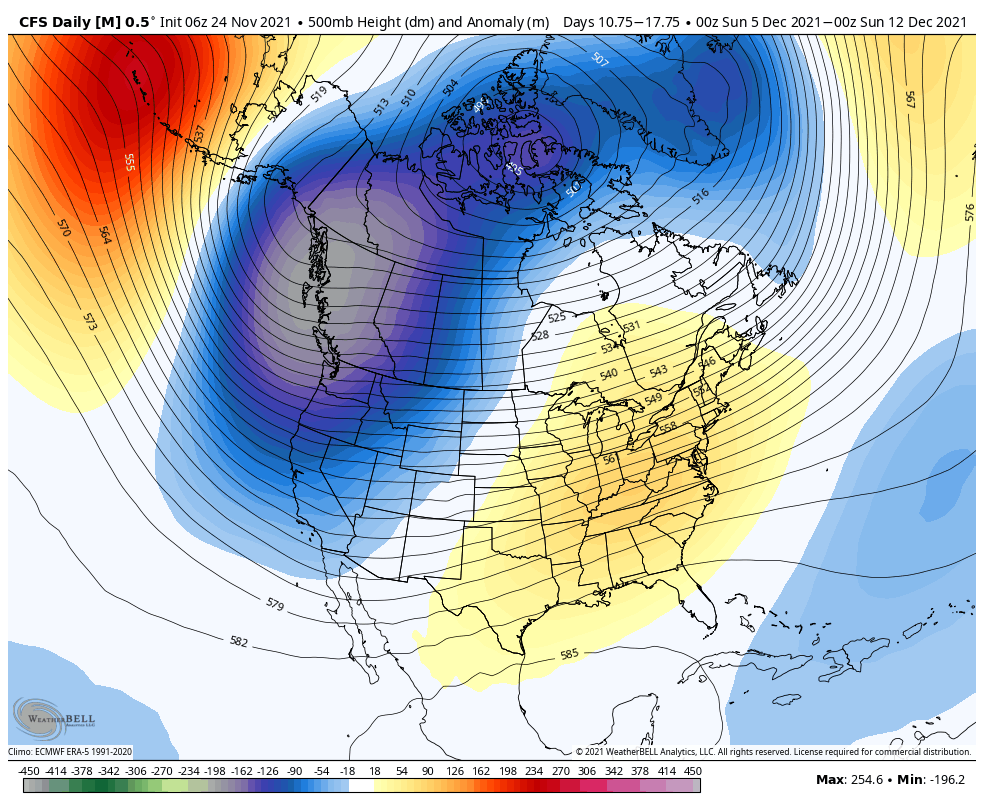
Ideally we would like to see that trough a little farther east, but that is still a very favorable signal for getting cold air to the coastal lowlands.
That may only be the beginning, as these longer-range models all seem to keep the cold pattern around through the month of December. I hate to put too much trust in these unreliable 15-30+ day forecasts, but given the consensus from different models and the La Niña/negative PDO state of the Pacific Ocean, I would be surprised if December did not end up being a chilly month with several opportunities for lowland snow. Stay tuned.

Although November has felt wet and cold here in Bellingham, in fact the average temperature for both daily lows and highs has been above normal so far. Only 6 days have had lows below normal and 18 days have been above normal. There has been very little in the way of sub-freezing temperatures as evidenced by the fact that many plants have not really gone into dormancy. The sparse snow pack is consistent with the higher nighttime lows and the generally higher freezing level associated with these atmospheric rivers.
LikeLike
November 25, 27, and 28 set daily precipitation records for Bellingham to go with similar records set on November 14 and 15. Five daily records for November 2021 seems a bit more than a random event to me. Minimum low temperatures continued well above normal lows during this last week of November (8 to 16 degrees F. above normal). At the moment, it does not look like we will set a daily precipitation record for November 30 but the nighttime low was 51, 15 degrees above normal.
LikeLike